Emma Waugh
Check out my work and reflections in Open Source GIScience!
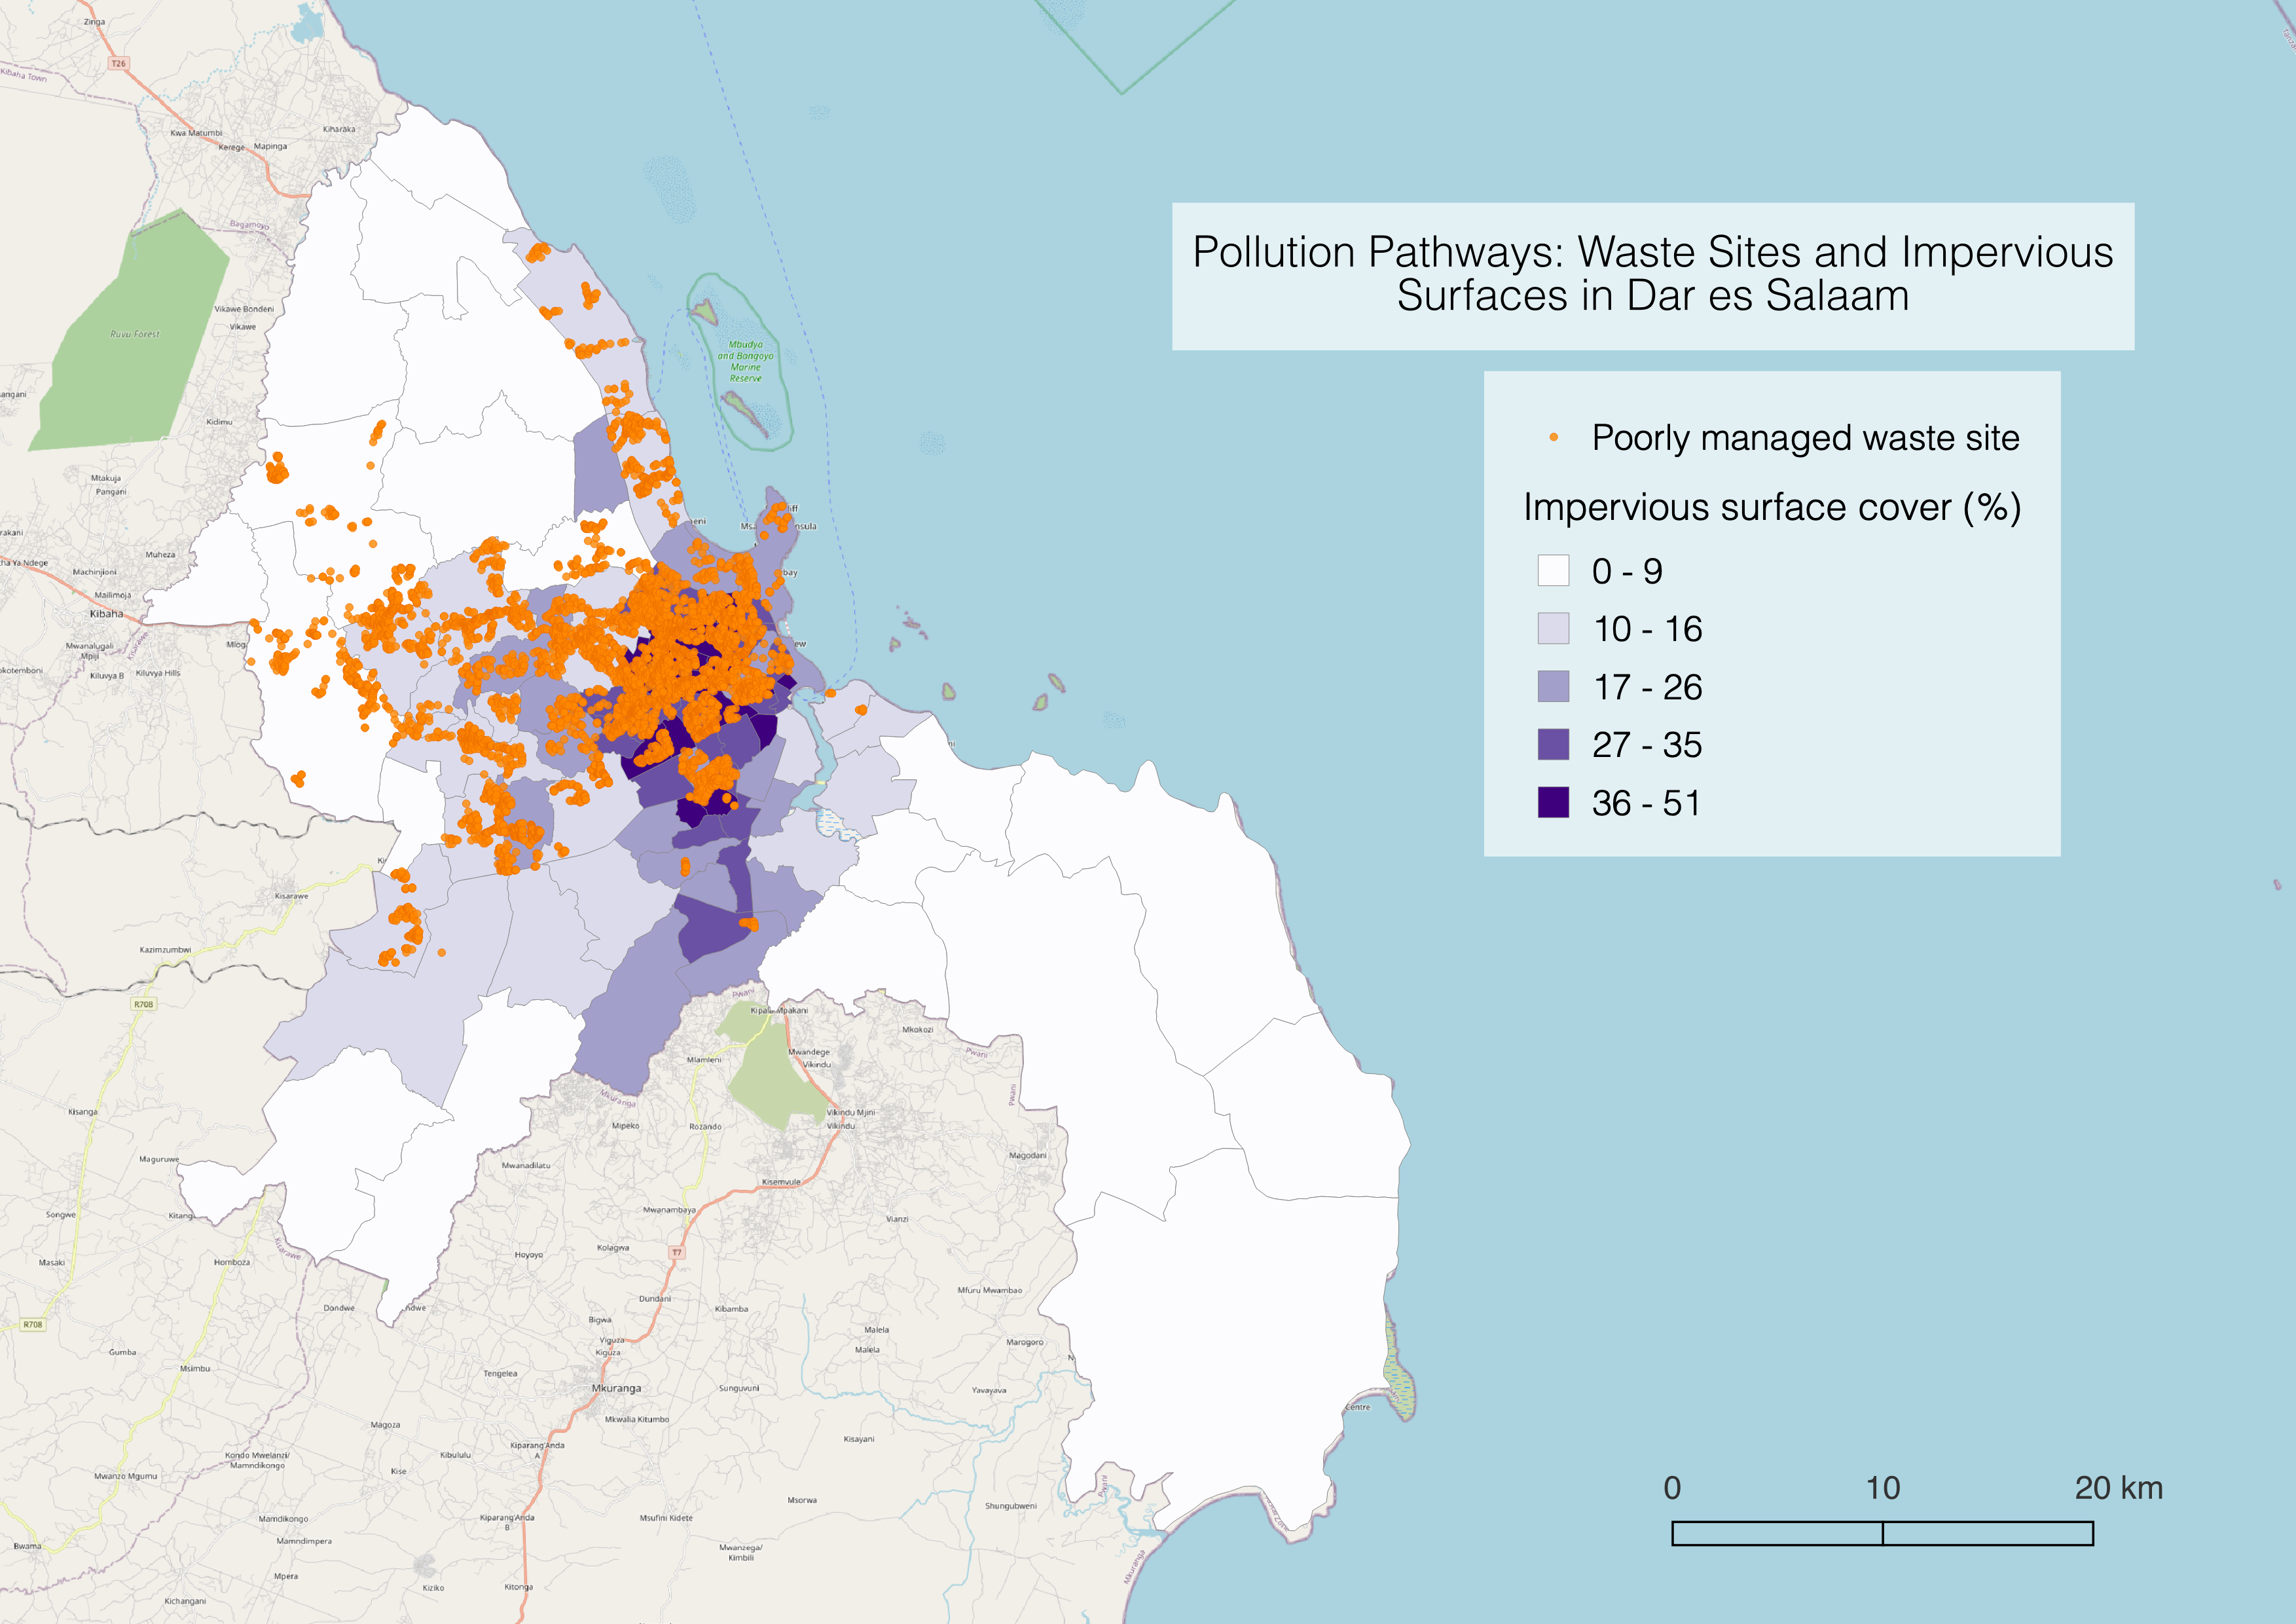
Pollution Pathways: Waste Sites and Impervious Surfaces in Dar es Salaam
Emma Waugh, Middlebury College
| Version 1.0 | Created 2021-10-14 | Last Updated 2021-12-17 |
The reproducible research compendium for this study is located here.
Background
The presence of impervious ground materials, including paved or hardpacked roads and paths as well as buildings, means lower infiltration rates and increased quantities of runoff during storm events. This results in the transport of pollutants in surface water, which may ultimately end up in aquatic ecosystems and drinking water sources.
This study aims to characterize the risk for pollutant transport during rain events via measurement of impervious surface cover and poorly managed solid waste sites throughout the wards of Dar es Salaam, Tanzania.
Keywords
Dar es Salaam, impervious surfaces, waste, flood resilience
Methods
This study is an analysis of impervious surface cover and waste site management across 95 wards in Dar es Salaam, Tanzania, to determine wards with higher risk of surface water contamination during flood events. All analysis is on the ward scale, with impervious surface cover and waste sites aggregated by ward location. The GitHub repository for this study is available here.
Data sources
- OpenStreetMap is a global collaborative geographic database
planet_osm_roadsandplanet_osm_polygonlayers for impervious surface cover throughout Dar es Salaam (as of October 2021)
- ResilienceAcademy is a project that uses digital tools and open source data to address climate-related risks and vulnerabilities in urban areas. The Climate Risk Database is a geospatial data repository for disaster research and management.
Dar es Salaam Waste Sitespoints with poorly managed solid waste sites, mapped as part of the Let’s Do It World cleanup project
Data preparation
First, I defined impervious surfaces as areas where water can’t infiltrate the ground. In the context of Dar es Salaam’s OpenStreetMap data, that meant having a paved or asphalt surface, or being a building. I identified all paved roads (polylines) and polygons in the database.
CREATE TABLE impervroads
AS
SELECT osm_id, way
FROM planet_osm_roads
WHERE surface = 'paved' OR surface = 'asphalt';

CREATE TABLE impervpoly
AS
SELECT osm_id
FROM planet_osm_polygon
WHERE surface = 'paved' OR surface = 'asphalt' OR building IS NOT NULL;
In order to combine the two above queries into one with all impervious surfaces, I first buffered the road polylines to make them into polygons. I determined that 5m (in each direction) was a reasonable buffer based on measurement of paved roads via satellite imagery.
I also reprojected both layers and the wards layer into the EPSG:32737 coordinate reference system and typecast them as multipolygons.
CREATE TABLE impervsurf
AS
SELECT osm_id, st_buffer(st_transform(way, 32737), 5)::geometry(multipolygon, 32737) AS geom FROM impervroads
UNION
SELECT osm_id, st_transform(way, 32737)::geometry(multipolygon,32737) AS geom FROM impervpoly;

CREATE TABLE wards_repro
AS
SELECT wards.id, wards.ward_name, wards.totalpop, st_transform(geom, 32737)::geometry(multipolygon, 32737) AS geom FROM wards;
Data analysis
I intersected the impervious surface layer with the wards layer in order to assign ward information to each impervious feature. I aggregated the impervious surfaces by ward, creating a multipart feature with all impervious surfaces for each ward.
Note: st_collect can also be used to group geometries by ward. st_union is more computationally-intensive, but ensures that overlapping building or road features are accounted for.
CREATE TABLE impervsurf_withward
AS
SELECT impervsurf.osm_id, st_multi(st_intersection(impervsurf.geom, wards_repro.geom))::geometry(multipolygon, 32737) AS geom, wards_repro.ward_name
FROM impervsurf2 INNER JOIN wards_repro
ON st_intersects(impervsurf.geom, wards_repro.geom);
I then selected all waste sites from the ResilienceAcademy’s Dar es Salaam Waste Sites layer, and reprojected them to match the ward geometry. Then, I intersected them with the ward layer to assign ward information to each waste site point. Then I grouped the waste sites by ward, counting the total for each ward.
CREATE TABLE waste_repro
AS
SELECT waste.waste_site, waste.clean_up_m, st_transform(waste.geom, 32737)::geometry(point, 32737) AS geom FROM waste;

CREATE TABLE waste_withward
AS
SELECT wards_repro.ward_name, waste_repro.waste_site, waste_repro.clean_up_m, st_multi(waste_repro.geom)::geometry(multipoint, 32737) AS geom, wards_repro
FROM waste_repro INNER JOIN wards_repro
ON st_intersects(waste_repro.geom, wards_repro.geom);

CREATE TABLE waste_byward
AS
SELECT ward_name, st_multi(st_union(waste_withward.geom))::geometry(multipoint, 32737) AS geom, count(ward_name)
FROM waste_withward
GROUP BY ward_name;
To determine wards’ proportion of impervious surfaces and waste site densities, I joined those totals to the original ward geometry to compare them to each wards’ area.
First, I calculated total area of impervious surfaces by ward, and joined that information back to the original ward geometry to determine the proportion of impervious surface in each ward.
ALTER TABLE impervsurf_byward
ADD COLUMN impervarea int;

UPDATE impervsurf_byward
SET impervarea = st_area(geom);

ALTER TABLE wards_repro
ADD COLUMN impervarea int;

UPDATE wards_repro
SET impervarea = impervsurf_byward.impervarea
FROM impervsurf_byward
WHERE impervsurf_byward.ward_name = wards_repro.ward_name;

ALTER TABLE wards_repro
ADD COLUMN propimperv real;

UPDATE wards_repro
SET propimperv = impervarea / st_area(geom)::real;

ALTER TABLE wards_repro
ADD COLUMN pct_imperv real;

UPDATE wards_repro
SET pct_imperv = propimperv * 100::real;
Then, I joined the waste site counts back to the original ward geometry. To normalize the number of waste sites by ward area, I calculated density by dividing total sites by ward area.
ALTER TABLE wards_repro
ADD COLUMN wastecount int;

UPDATE wards_repro
SET wastecount = waste_byward.count
FROM waste_byward
WHERE waste_byward.ward_name = wards_repro.ward_name;

ALTER TABLE wards_repro
ADD COLUMN waste_density real;

UPDATE wards_repro
SET waste_density = wastecount / st_area(geom)::real;
I convert to the density unit from per square meter to per square kilometer to make it more intuitive.
ALTER TABLE wards_repro
ADD COLUMN waste_dens_km real;

UPDATE wards_repro
SET waste_dens_km = waste_density * 1000000::real;
Results
Click the map to navigate to the interactive web map of this study!
While this study produced information on waste site density and impervious surfaces that could inform ward-level waste management and flood resilience practices in Dar es Salaam, it also revealed the limitations in using OSM data for such an analysis.
The table below contains wards and accompanying waste site densities and impervious surface cover for the wards with the 5 highest waste site density. Within those, impervious surface cover ranges from 25-51%. Overall, waste site density ranges from 0-180 sites per square km, and impervious surface cover ranges widely from 0.2-51%.
| Ward | Waste sites per sqkm | Impervious surface cover (% area) |
| Magomeni | 180 | 30 |
| Manzese 171 | 47 | |
| Hananasifu | 156.211 | 30 |
| Tandale | 153 | 51 |
| Mchikichini | 148 | 25 |
Most wards with high waste site density (50-180 sites/sqkm) also had relatively high impervious surface cover (20-51%), while the lower range (0-50 sites/sqkm) ranged 0-40% impervious cover. The more urban wards closer to Dar es Salaam’s center tend to have both higher impervious surface area and more waste sites.
The map above shows waste sites in orange, and indicates impervious surface cover by shade of purple. The waste sites appear to be concentrated in the wards northwest from the center of the city.
Data limitations
Impervious surfaces are open source data mapped by thousands of contributors, and therefore cannot be considered exhaustive. In this study, it appears that impervious surfaces are not consistent throughout wards. A visual comparison with satellite imagery of Dar es Salaam suggests that some primary roads are not included in planet_osm_roads. (It does appear that the majority of OpenStreetMap listings for both planet_osm_roads and planet_osm_polygon were created or edited in the last 3 and 6 years, respectively, meaning they are likely not outdated. However, there are relatively few features in planet_osm_roads (1,700) compared to planet_osm_polygon (1.3 million) and planet_osm_lines (134,000). It may have been more effective to filter line features for roads instead of using the seemingly less-created roads layer.)
Finally, the road buffer of 5m (total 10m width) was based on a visual inspection and measurement of roads in satellite imagery, and is a reasonable width for primary paved roads. However, those primary roads are not differentiated from secondary roads and may therefore overestimate road surfaces. Unpaved but hardpacked surfaces, such as on footpaths and dirt roads, are similarly impervious to paved roads, but were not included in this analysis. Since overall impervious surface appears to be underestimated in this context, I don’t think road buffers impacted the results of this analysis.