Emma Waugh
Check out my work and reflections in Open Source GIScience!
Reproduction of COVID-19 Distribution and Disability in the US
December 2021
This is a reproduction of Chakraborty (2021), first implemented by Joseph Holler, Drew An Pham, Derrick Burt, and Peter Kedron in July 2021. GEOG 323: Open Source GIScience reproduced it again in Fall 2021.
My version of the reproduction, based on the above, is linked here.
Background
The COVID-19 pandemic has highlighted many social vulnerabilities. COVID-19 risk is exacerbated by living conditions, pre-existing health conditions, and barriers to accessing health services. Similarly, people with disabilities face additional challenges during the pandemic, including mitigating exposure to prevent COVID-19 (social distancing may be difficult for those who need help with personal care or live in group settings), or accessing healthcare (people with disabilities can experience discrimination or communication gaps with healthcare providers) (Chakraborty 2021).
Higher COVID-19 transmission and COVID-19 death rates have been recorded in counties with more marginalized residents. Chakraborty searched for similar relationships in areas with higher rates of people with disabilities, especially those with additional socio-demographic disadvantages.
Original Study Design
To investigate these relationships, Chakraborty used county-level COVID-19 case data (normalized as confirmed cases per 100,000 people) from Johns Hopkins University from August 1, 2020. He sourced disability as well as race, ethnicity, sex, age, and poverty status from the 2018 ACS5-year estimate. A subgroup for disability plus each additional category was created (normalized by dividing by total population in each county).
First, Chakraborty completed bivariate Pearson product-moment correlations, in which he determined statistical correlations for each disability subgroup and COVID-19 incidence. He found that COVID-19 incidence and overall disability were weakly but significantly negatively correlated, as well as COVID-19 incidence and people with disabilities that are white, non-Hispanic white, above poverty, age 65+, and male. COVID-19 incidence and rates of Black, Asian, Hispanic, non-Hispanic and non-white, age 5-34 and below poverty people with disabilities are significant and positively correlated.
Generalized estimating equations (GEEs) allowed an analysis of spatial patterns within disability subgroups and COVID-19 in a non-normal and spatially clustered data distribution. Clusters of counties were defined using two methods. First, counties were clustered by state, as states generally oversee similar policies such as mask mandates and testing availability, as well as socio-cultural response to those policies. Then, he accounted for intra-state disparities and interstate patterns by using SatScan software to determine spatial clusters with the Poisson model. Then relative risk, which is (local cases / local population) / (total - local cases / total - local population) was estimated for each cluster. Chakraborty applied a score of 1-6 to each county, with 1 as lowest relative risk and 6 as highest relative risk. Five GEEs were modeled, one for each subgroup. The results of the GEEs were similar; positive associations with COVID-19 incidence were found within white, Hispanic and non-Hispanic non-white, below poverty, age 5-17 years, and female groups.
Our Results
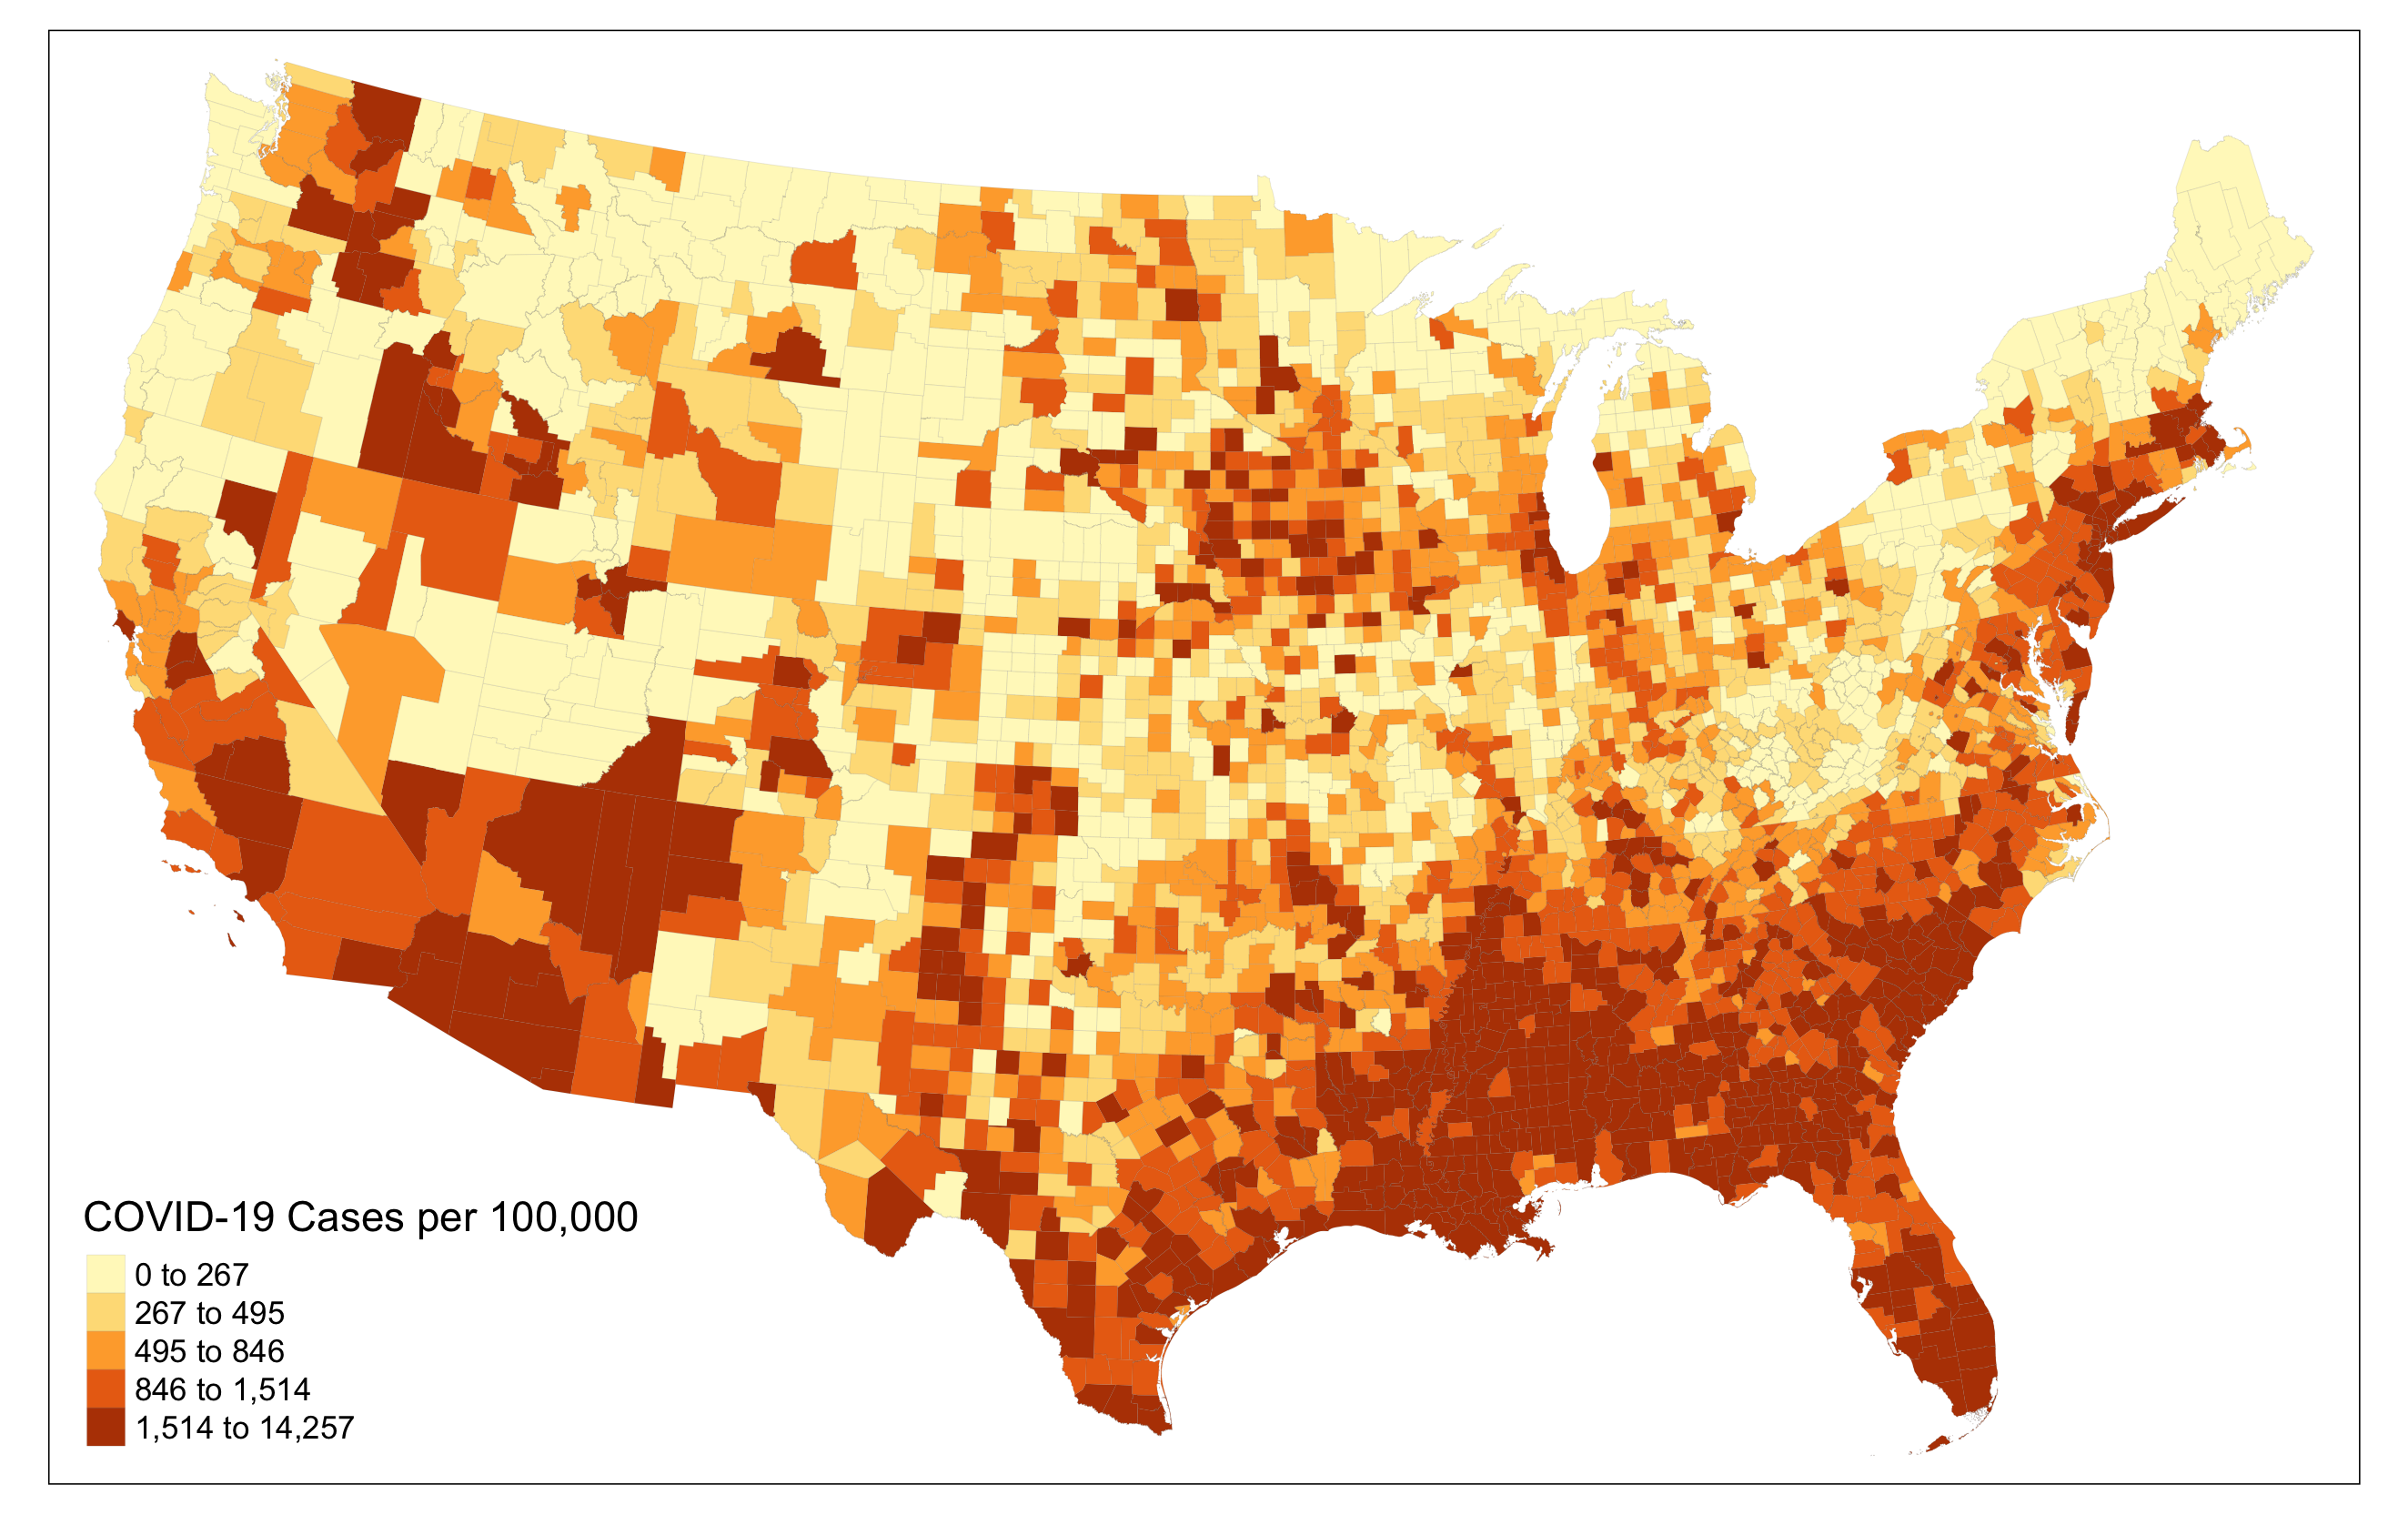
First, we reproduced Chakraborty’s U.S. map of COVID-19 incidence (cases per 100,000). (The August 1, 2020 COVID-19 data used in the original study is no longer available via Johns Hopkins, so it is provided within the research compendium.)
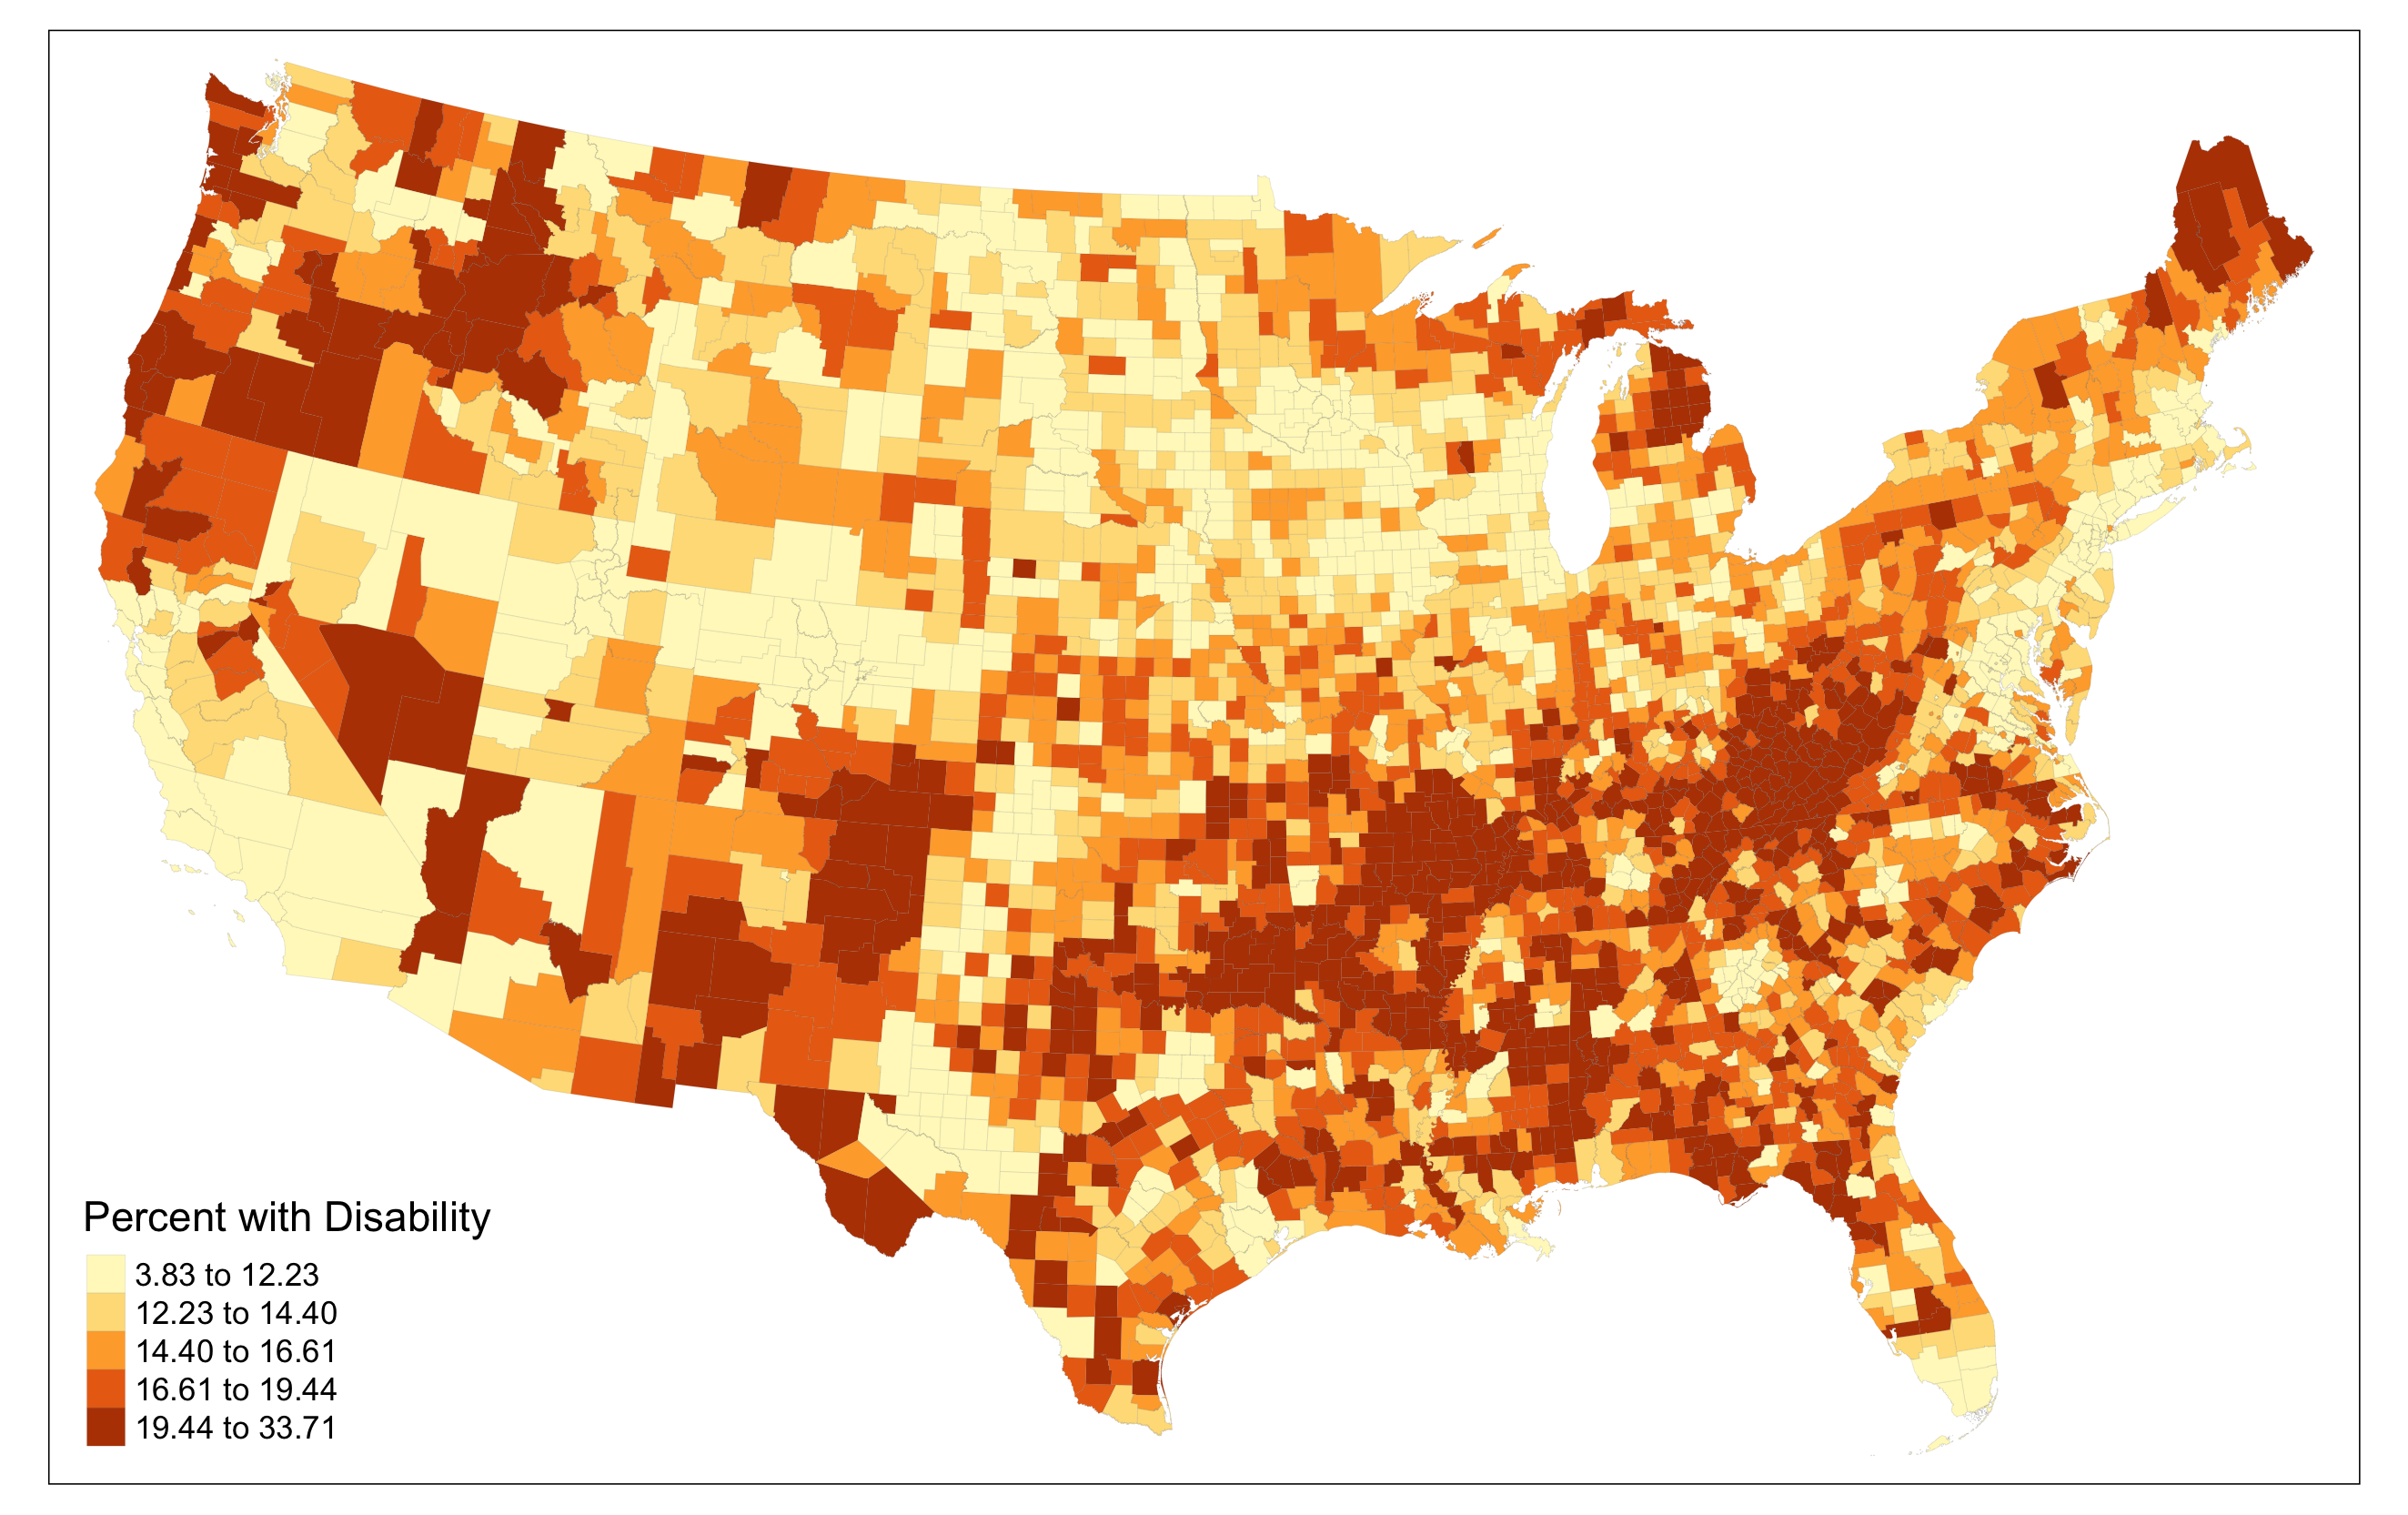
We also created a map of disability rates in U.S. counties. This allows for a initial visual comparison of COVID-19 and disability spatial patterns.
We then calculated Pearson’s R correlation coefficients for each of the subgroups, and found identical direction and significance to Chakraborty’s results, though a difference in magnitude. Pearson’s correlation assumes a normal distribution, a characteristic this data does not have, so we calculated Spearman’s rho, a non-parametric correlation test, as well. This test had different directions and magnitudes for some groups; for instance, the disabled Native American and female subgroups switched from positive to negative correlation with COVID-19 incidence (see table below for our results).
| Variable (Percent with Disability) | Pearson’s R | Spearman’s rho |
|---|---|---|
| Total | -0.06** | -0.113** |
| White alone | -0.332** | -0.421** |
| Black alone | 0.46** | 0.575** |
| Native American | 0.019 | -0.084** |
| Asian alone | 0.094** | 0.194** |
| Other race | 0.026 | 0.104** |
| Non-Hispanic white | -0.361** | -0.454** |
| Hispanic | 0.119** | 0.231** |
| Non-Hispanic non-white | 0.442** | 0.481** |
| Below poverty level | 0.106** | 0.062** |
| Above poverty level | -0.151** | -0.205** |
| Age 5-17 | 0.084** | 0.079** |
| Age 18-34 | 0.063** | 0.034* |
| Age 35-64 | -0.008 | -0.02 |
| Age 65-74 | -0.091** | -0.151** |
| Age 75+ | -0.186** | -0.285** |
| Male | -0.134** | -0.201** |
| Female | 0.023 | -0.014 |
**p<0.01, *p<0.05
Last, we implemented the GEEs to model likelihoods of COVID-19 incidence (i.e. the relative risk for clusters) based on various correlations, including all the socio-demographic categories as well as space. To create the clusters Chakraborty used SatScan, which is a proprietary software based on the Kulldorff spatial scan statistic. We instead used the Kulldorff cluster detection tool from Albert Kim’s SpatialEpi package.
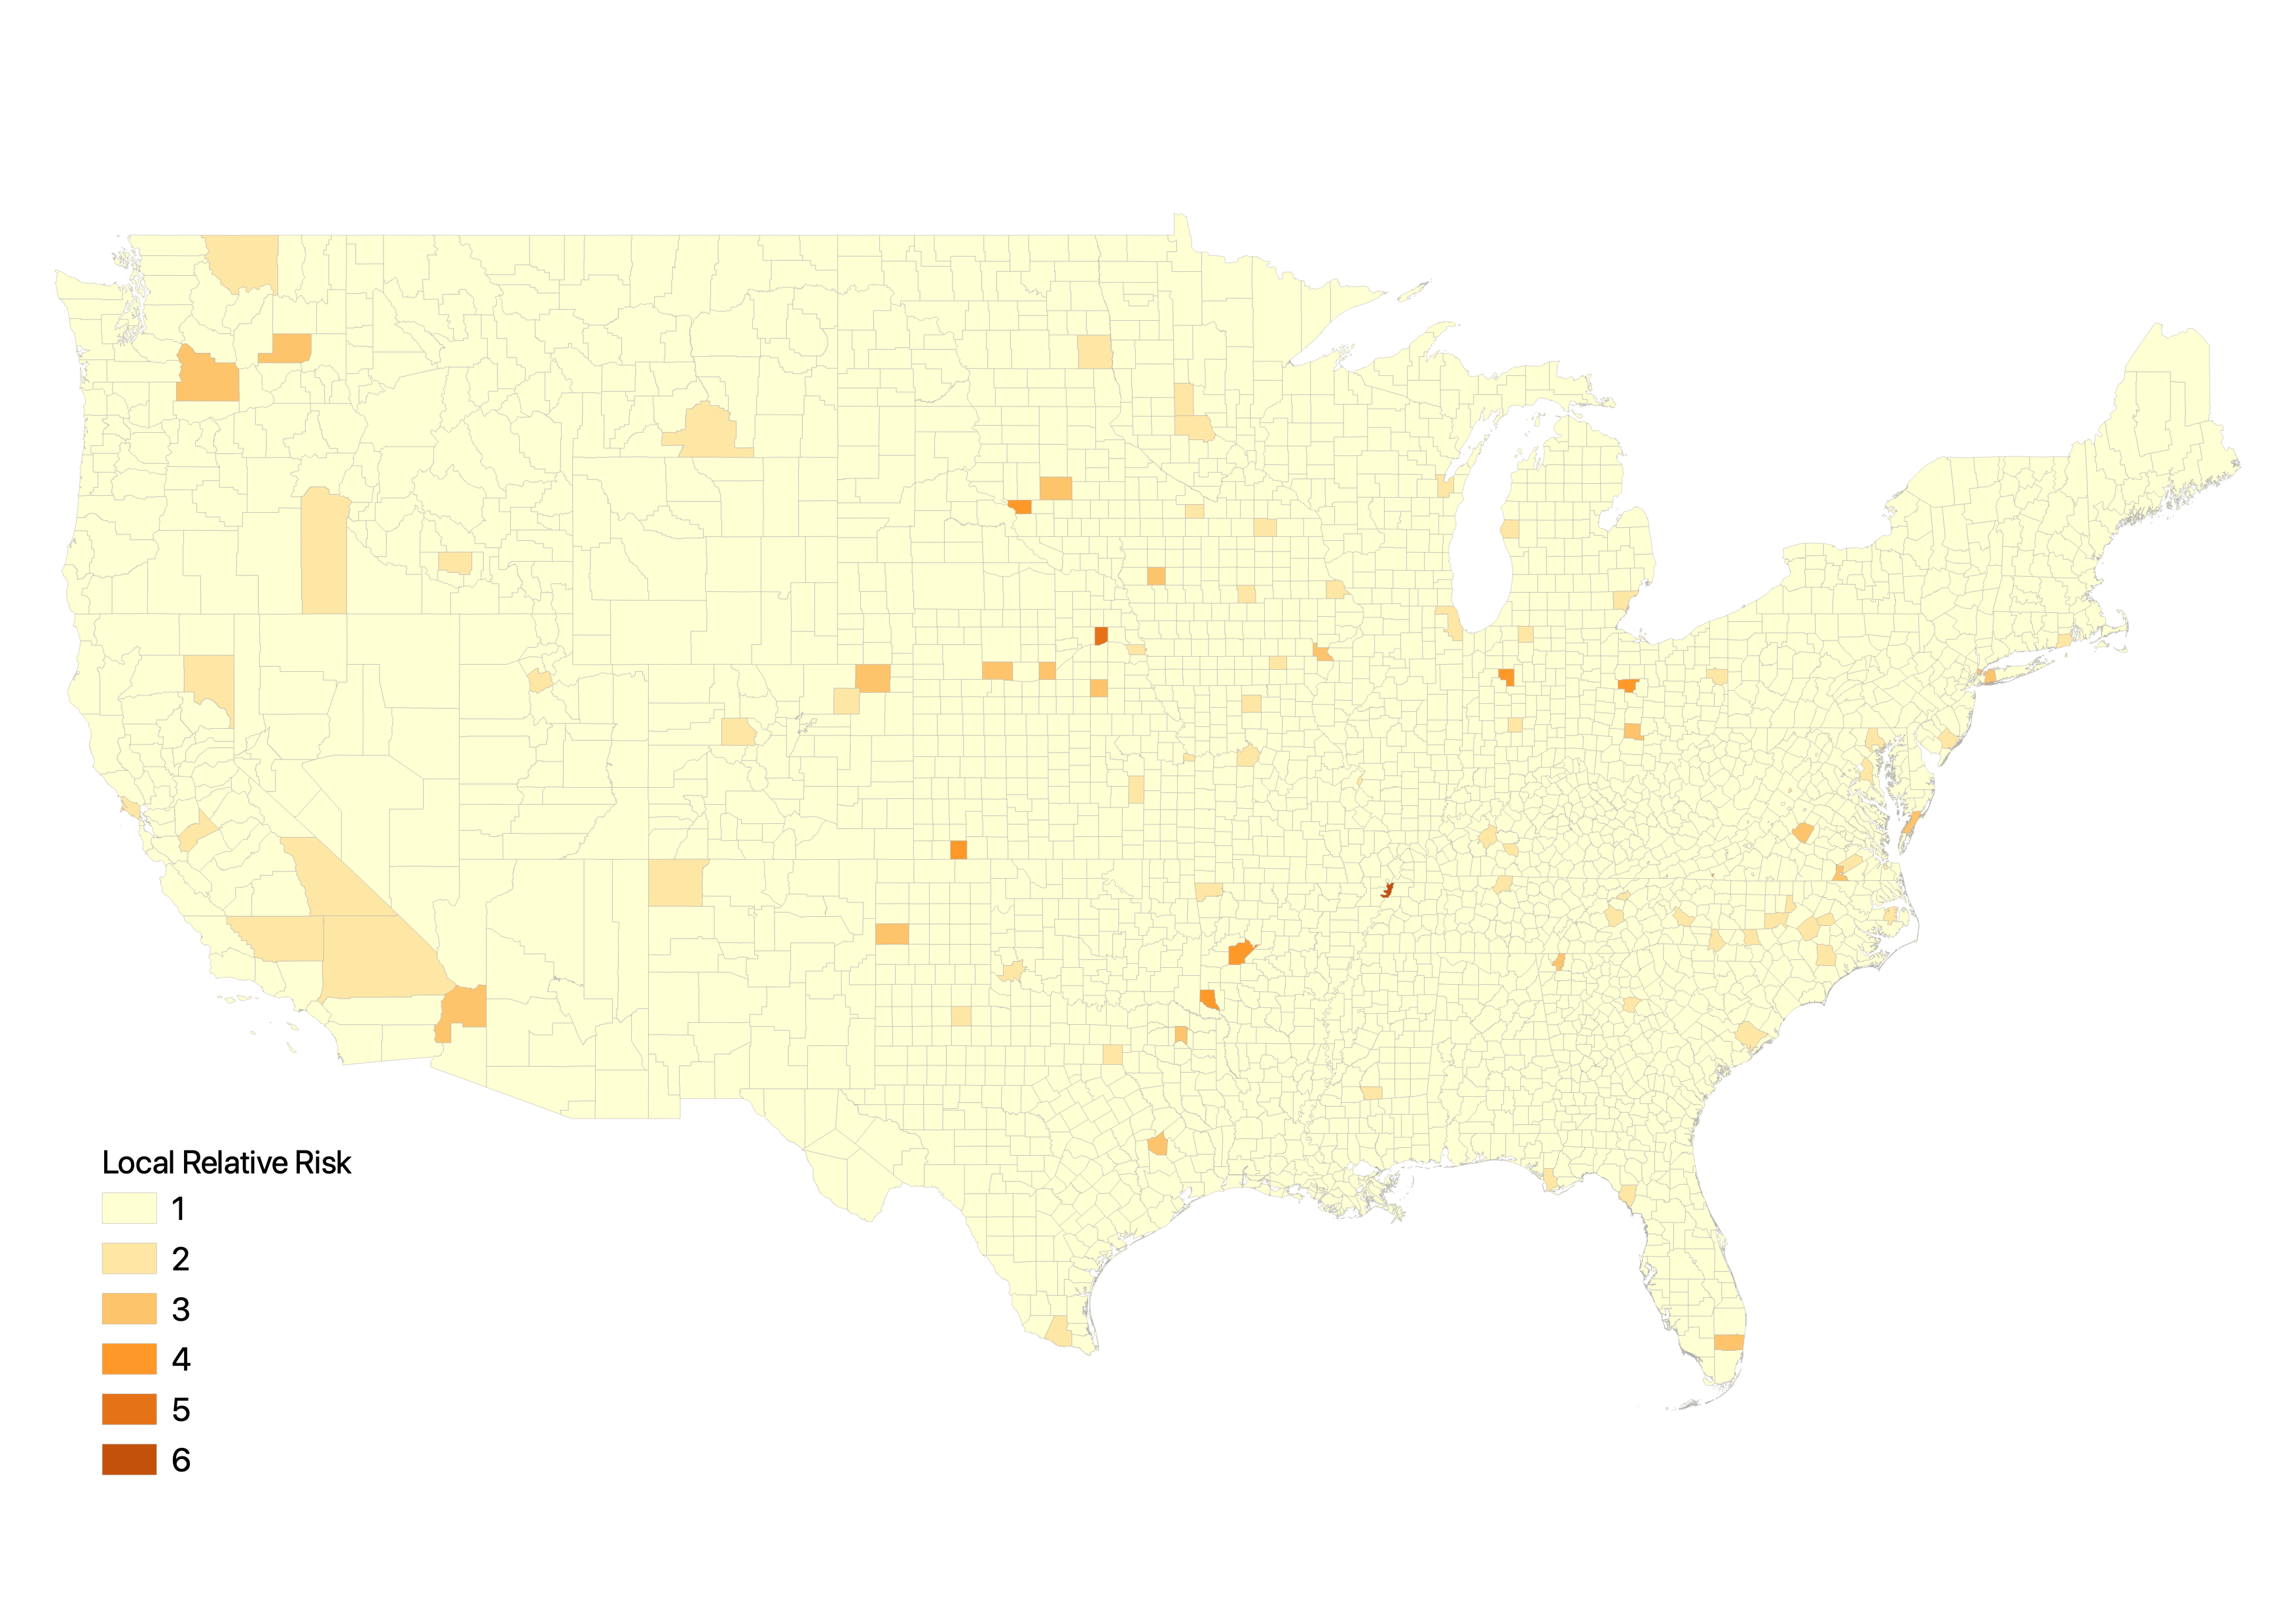
Chakraborty calculated the risk score for only the center county in each cluster, which is unrepresentative of true risk, and when mapped is visually uninformative because it doesn’t show risk anywhere else (map created by Liam Smith).
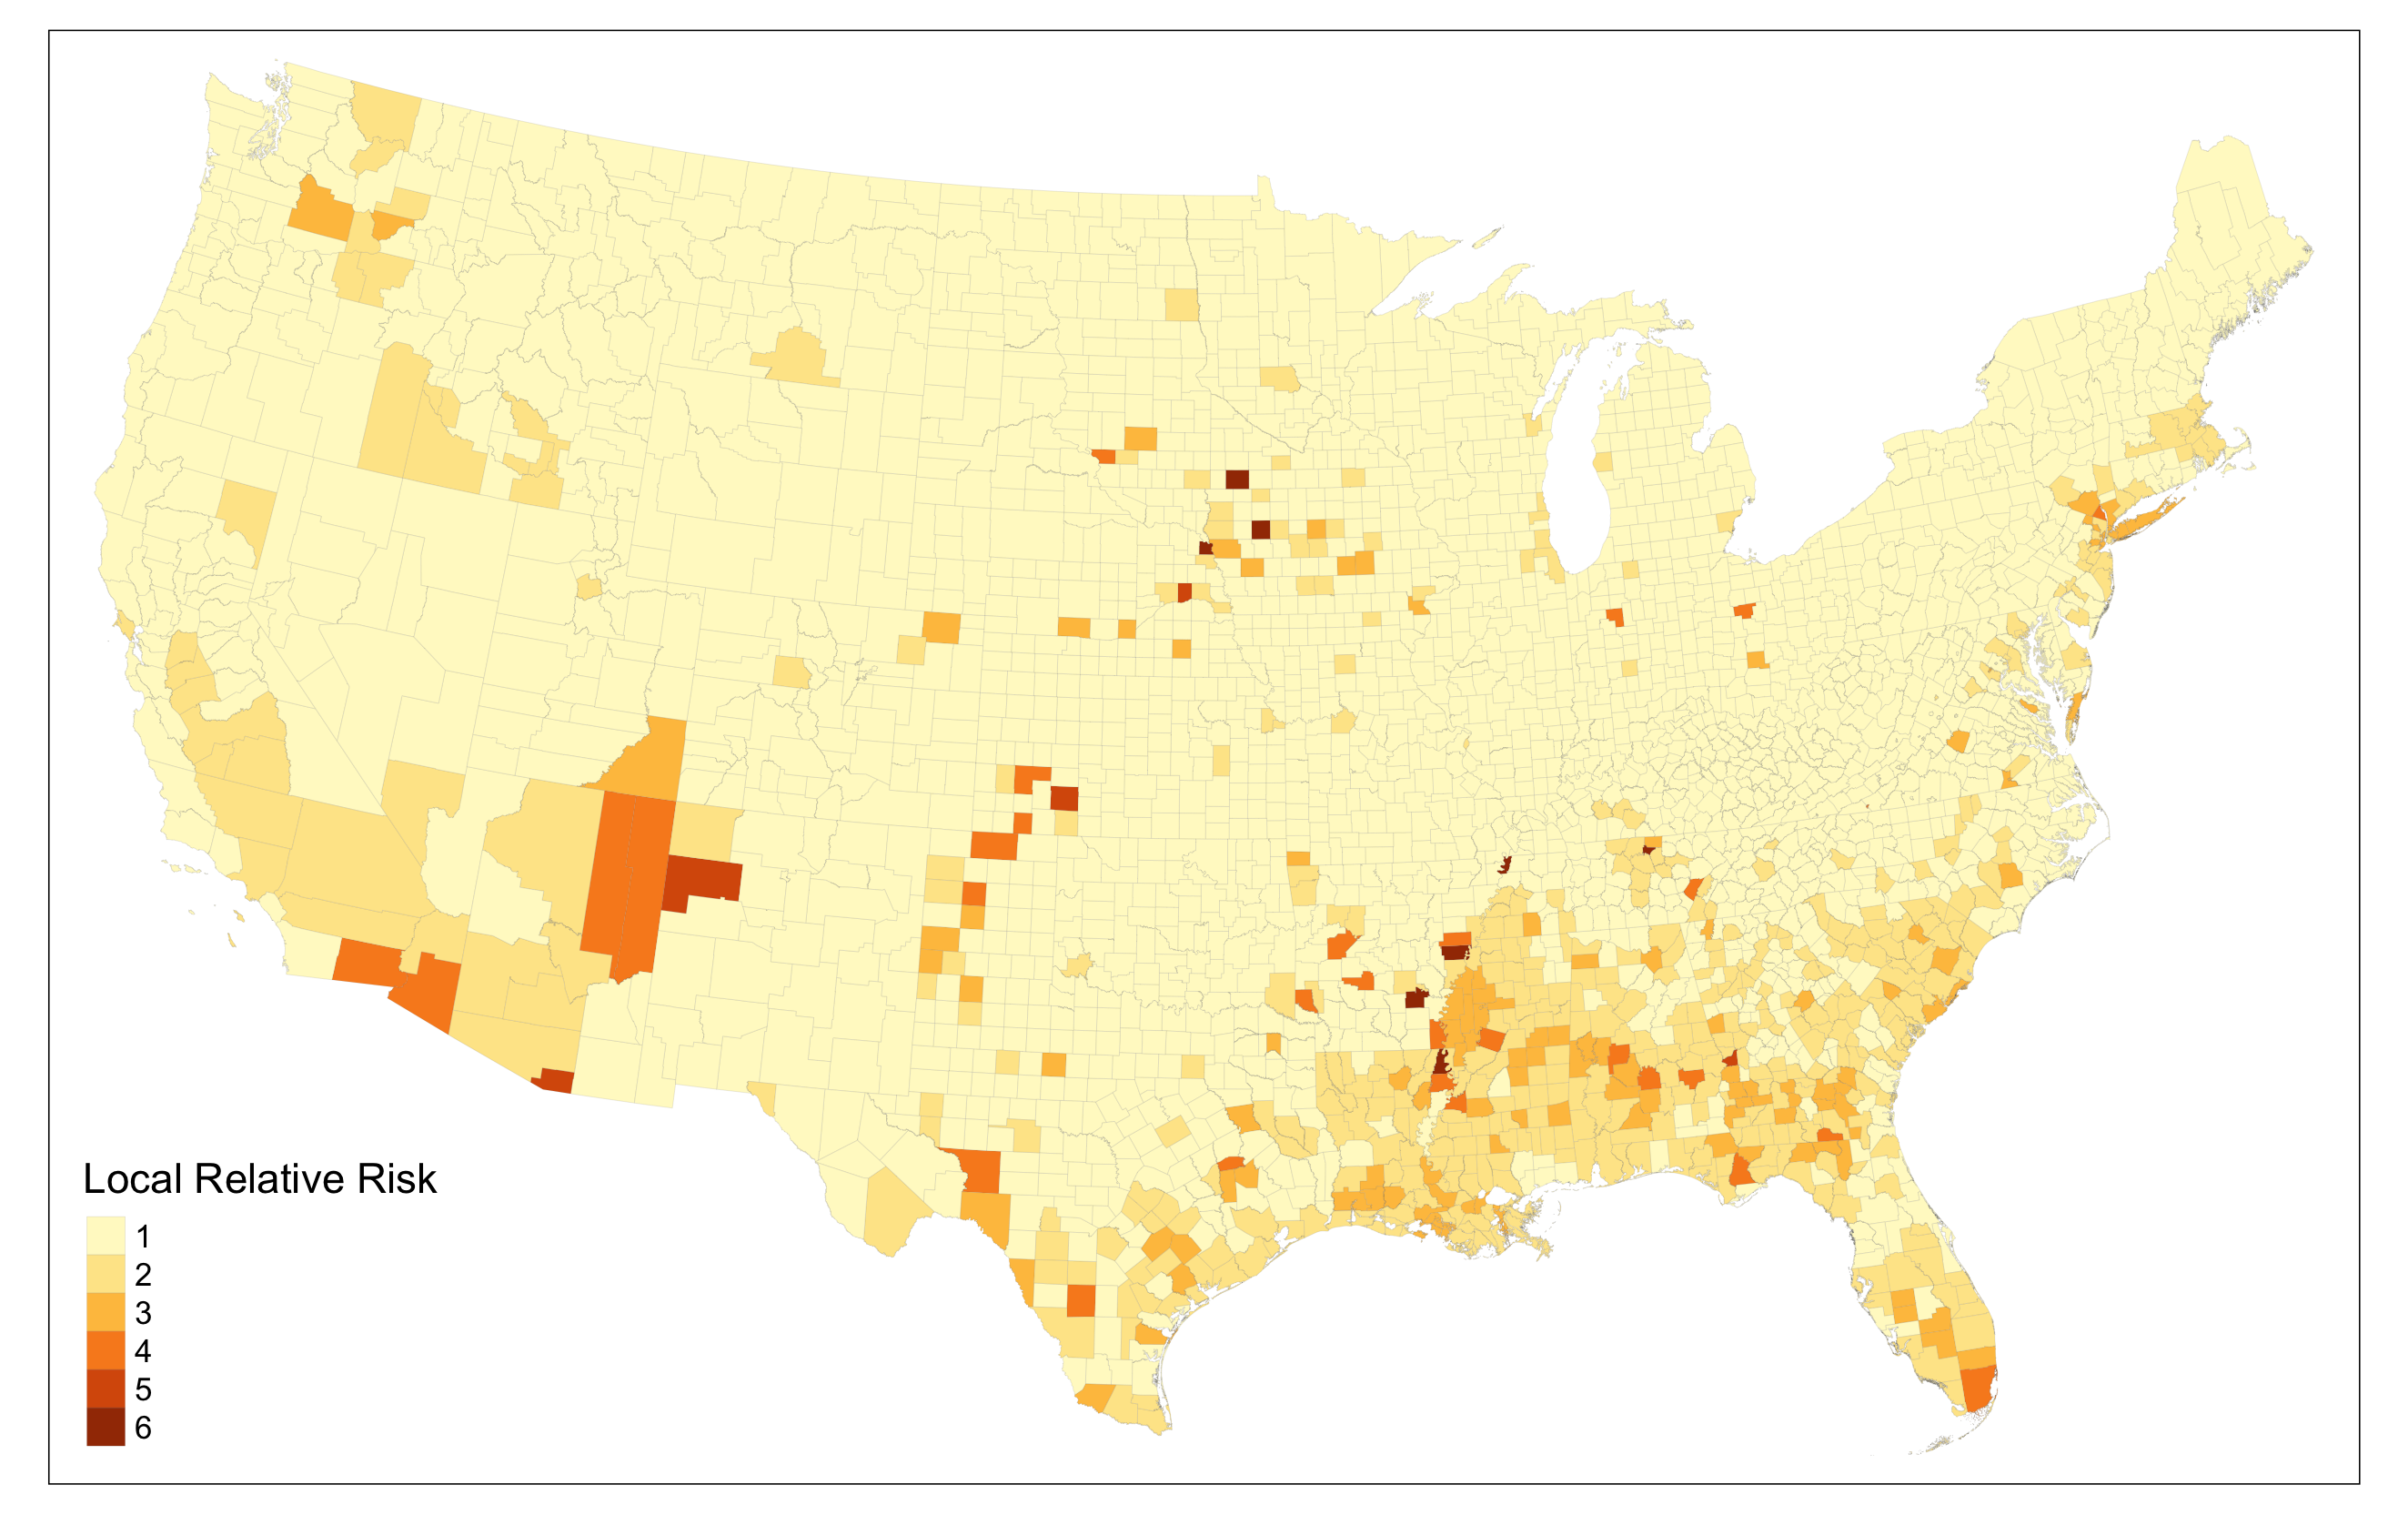
We instead calculated relative risk for every county in a cluster, which displays risk levels in counties that are still high compared to outside clusters.
Conclusions
There are many socio-demographic variables that can lead to exacerbated impacts from the COVID-19 pandemic. Modeling those variables to predict COVID-19 transmission and death rates can highlight needs for additional resources in areas with high rates of disadvantaged people with disabilities.
This reproduction successfully generates similar results to Chakraborty’s original study, though some improvements (calculating Spearman’s rho for the bivariate analysis as well, and determining relative risks for all counties in clusters) make the results more accurate.
Reference
Chakraborty, J. 2021. Social inequities in the distribution of COVID-19: An intra-categorical analysis of people with disabilities in the U.S. Disability and Health Journal 14 (1):101007. DOI: 10.1016/j.dhjo.2020.101007.