Emma Waugh
Check out my work and reflections in Open Source GIScience!
Uncertainties in a Climate Vulnerability Analysis of Malawi
November 8, 2021
An attempted reproduction of the Malcomb et al. (2014) climate vulnerability model in Malawi revealed errors and assumptions that impacted the results of the model.
The study’s aim was to complement the Malawi government’s vulnerability assessments, and prepare stakeholders and policymakers to “monitor complex vulnerability over time and direct forthcoming aid to the areas that are most in need of assistance.” Vulnerability indices have the power to impact response to changing conditions, as well as the outside perception of a community’s needs. It is obviously important for such an analysis to limit its uncertainty and error as much as possible, in order to effectively inform future infrastructure and resource allocation.
Framework For Vulnerability Modeling (Tate 2013)
Using the framework for analyzing uncertainty in social vulnerability analyses as developed by Tate (2013), I discuss the sources of error, uncertainty, and irreproducibility, as well as opportunities for propagation, in the Malcomb et al. study.
Model structure
Malcomb et al. used a hierarchical model structure, in which the structure is based on 12 variables, and organized by sub-themes. These sub-themes are called metathemes in this paper, and are:
- Adaptive capacity (subdivided into assets and access)
- Livelihood sensitivity
- Physical exposure
While the metathemes are logical, the structure is not statistically decisive like an inductive structure based on a regression model would be.
Indicator set
The indicator set provides “proxy variables for the underlying theoretical dimensions of social vulnerability” and must be selected carefully (Tate 2013). Malcomb et al. used 12 “evidence-based indicators” to determine location-specific issues and context. They consulted with locals, experts, and stakeholders to design their model.
However, it is apparent that they also took a practical approach, in that they used few available datasets from limited sources without collecting supplementary information. Because the model was based on data availability, theory, and value judgments but not statistical induction, it has not been shown to be statistically robust.
The indicators they chose, along with data sources and weights, are shown on page 23 of the paper, and summarized in the table below.
Metatheme | Weight Adaptive capacity | 40% Assets | Arable land (hectares) | 6% Number of livestock units | 4% Wealth index score | 4% Number in household sick in past year | 3% Number of orphans in household | 3% Access | Time to water source | 4% Own a cell phone | 4% Own a radio | 3% Electricity | 3% House setting (urban/rural 2% Type of cooking fuel | 2% Sex of head of household | 2% Livelihood sensitivity | 20% Percent of food from own farm | 6% Percent income from wage labor | 6% Percent income from cash crops | 4% Disaster coping strategy | 4% Physical exposure | 20% Estimated risk for flood hazard | 20% Exposition to drought events | 20%
Data sources:
- Demographic and Health Surveys (DHS) from the U.S. Agency for International Development (USAID), 2004 and 2010
- Famine Early Warning Systems Network (FEWSNET) Malawi-specific livelihood data
- United Nations Environment Programme (UNEP/GRID) global flood and drought exposure data
- Drought layer is not a measurement of drought risk, as it is used by Malcomb et al., and is actually the “expected average annual population…exposed.” It is essentially a proxy for population, and will show higher risk for densely populated areas and lower risk for low population areas.
- Flood layer is 1 (low risk) to 5 (extreme risk)
Analysis scale
In this study, the spatial units of analysis were traditional authorities (for the adaptive capacity index) and 0.0416 x 0.0416 degree raster cells (for total vulnerability). Traditional authorities are made up by multiple villages and are administrative units, meaning adaptive decisions could be made at that level.
Additionally, varying raster cell sizes for the climate data necessitated rescaling; Malcomb et al. chose to scale up to the higher resolution raster, which imposed higher levels of certainty on a low resolution dataset.
Measurement error
Measurement (and location) errors are an important source of uncertainty in multicriterial indices. Malcomb et al. do not mention their methods for dealing with missing data, such as questions within a survey, which is especially problematic because their index is based on a total (see below).
DHS household surveys were combined in 5 km clusters, so the precise locations of individual households are not available. Therefore, they could be mislocated in a neighboring traditional authority, a national park, or water body. It is unclear how Malcomb et al. addressed mislocated household information.
Addressing these sources of uncertainty and providing representation of error and uncertainty in the study would improve transparency and trust in the process.
Transformation and normalization
There is not a standard for how best to represent levels of vulnerability, as the total or relative number of relative populations may be more valuable depending on the context. However, some values (such as number of elderly or sick, or livestock count) are more meaningful when taken as a proportion of total household members, for example. This is especially important where population is not evenly distributed throughout the unit of analysis, which is the case in Malawi. Additionally, some adaptive assets with community benefits in the event of a natural hazard could be considered at the community level (such as percent of households with radio or phone). In any case, there are many indicators in the Malcomb et al. study that are ill-suited for total counts, and should have been transformed differently. As values were aggregated, they were normalized on a linear scale with values 1-5, which also complicates the indicators with binary or categorical outcomes. It is assumed that they used classified ‘no’ as 1 (or 0) and ‘yes’ as 5, though they never said that.
Weighting
Tate writes that weighting is the most “highly subjective” step in the creation of a vulnerability index. The indicators that carry the most weight will have a strong impact on the final index value, and making that decision and requires a deep understanding of all the factors at play in a system. Malcomb et al. adopted a normative strategy for assigning weights to the indicators, meaning the weights were based on their interviews with local stakeholders. With no statistical tests, there is limited understanding of interactions between indicators; if there are two or more indicators that are highly correlated, then they may be essentially “double-counted” (Tate).
Additionally, Malcomb et al. did not specify whether each indicator was considered “positive” or “negative” in this scheme, and some are unclear (especially the FEWSNET livelihood sensitivity indicators). A discussion of the conceptual relationship between indicators would have shown that some may cancel each other out (i.e. % income from cash crops vs. % food from own farm).
Aggregation
Malcomb et al. used additive aggregation to combine the values from the household cluster to traditional authority scale. This is not necessarily accurate, since certain values may essentially “substitute” each other (i.e. a high value for one indicator could replace a low value for another). While this may represent overall vulnerability, it ignores interactions between indicators and loses some of the nuances in vulnerability, especially where the weighting system is not statistically robust.
Uncertainty analysis, sensitivity analysis, and validation
Malcomb et al. do not include an uncertainty analysis or validation of their model. They did compare their results with some internal expert analysis, but do not discuss sources of uncertainty. Additionally, they did not use any mathematic or statistical tests on their results. During a future natural hazard event, they could use real outcomes to validate their model.
Discussion
Conducting reproductions and replications can help with social vulnerability model uncertainty, because the processes call into question all of the decisions that are made regarding data sources and workflow, including all the steps described above. My reproduction of Malcomb’s study is available here, and the results are below:
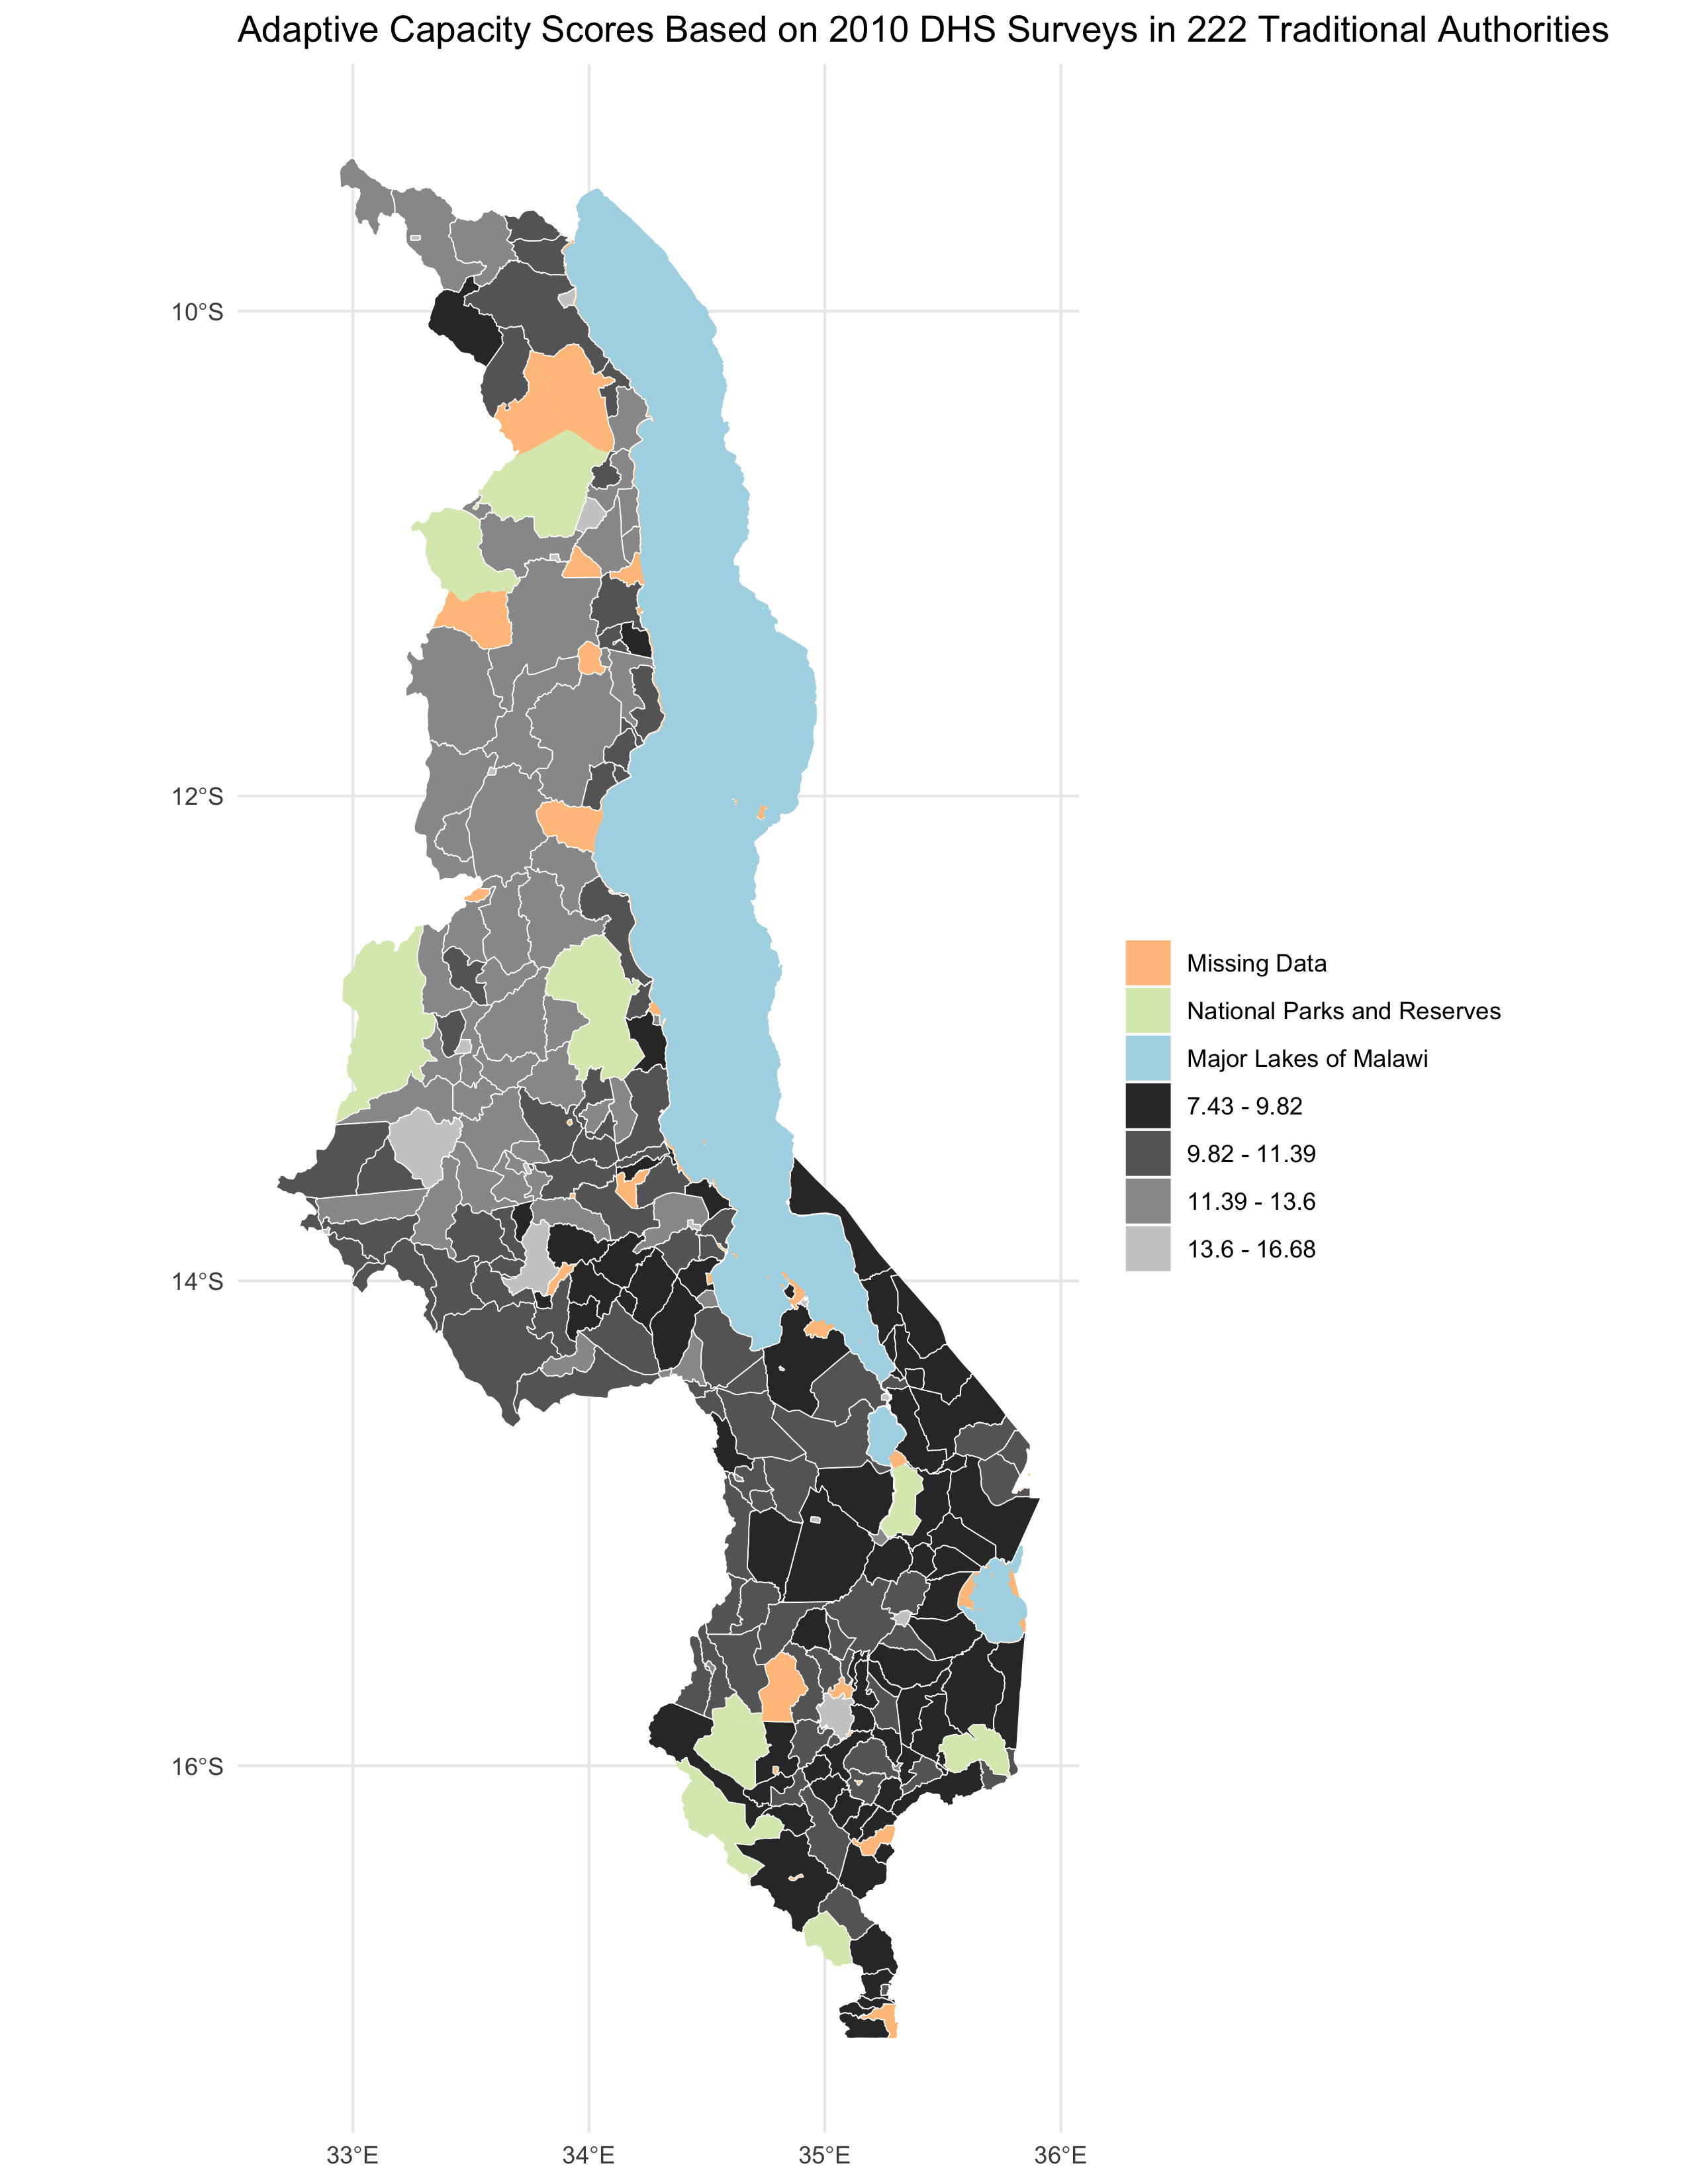 Reproduction of Malcomb et al. Figure 4.
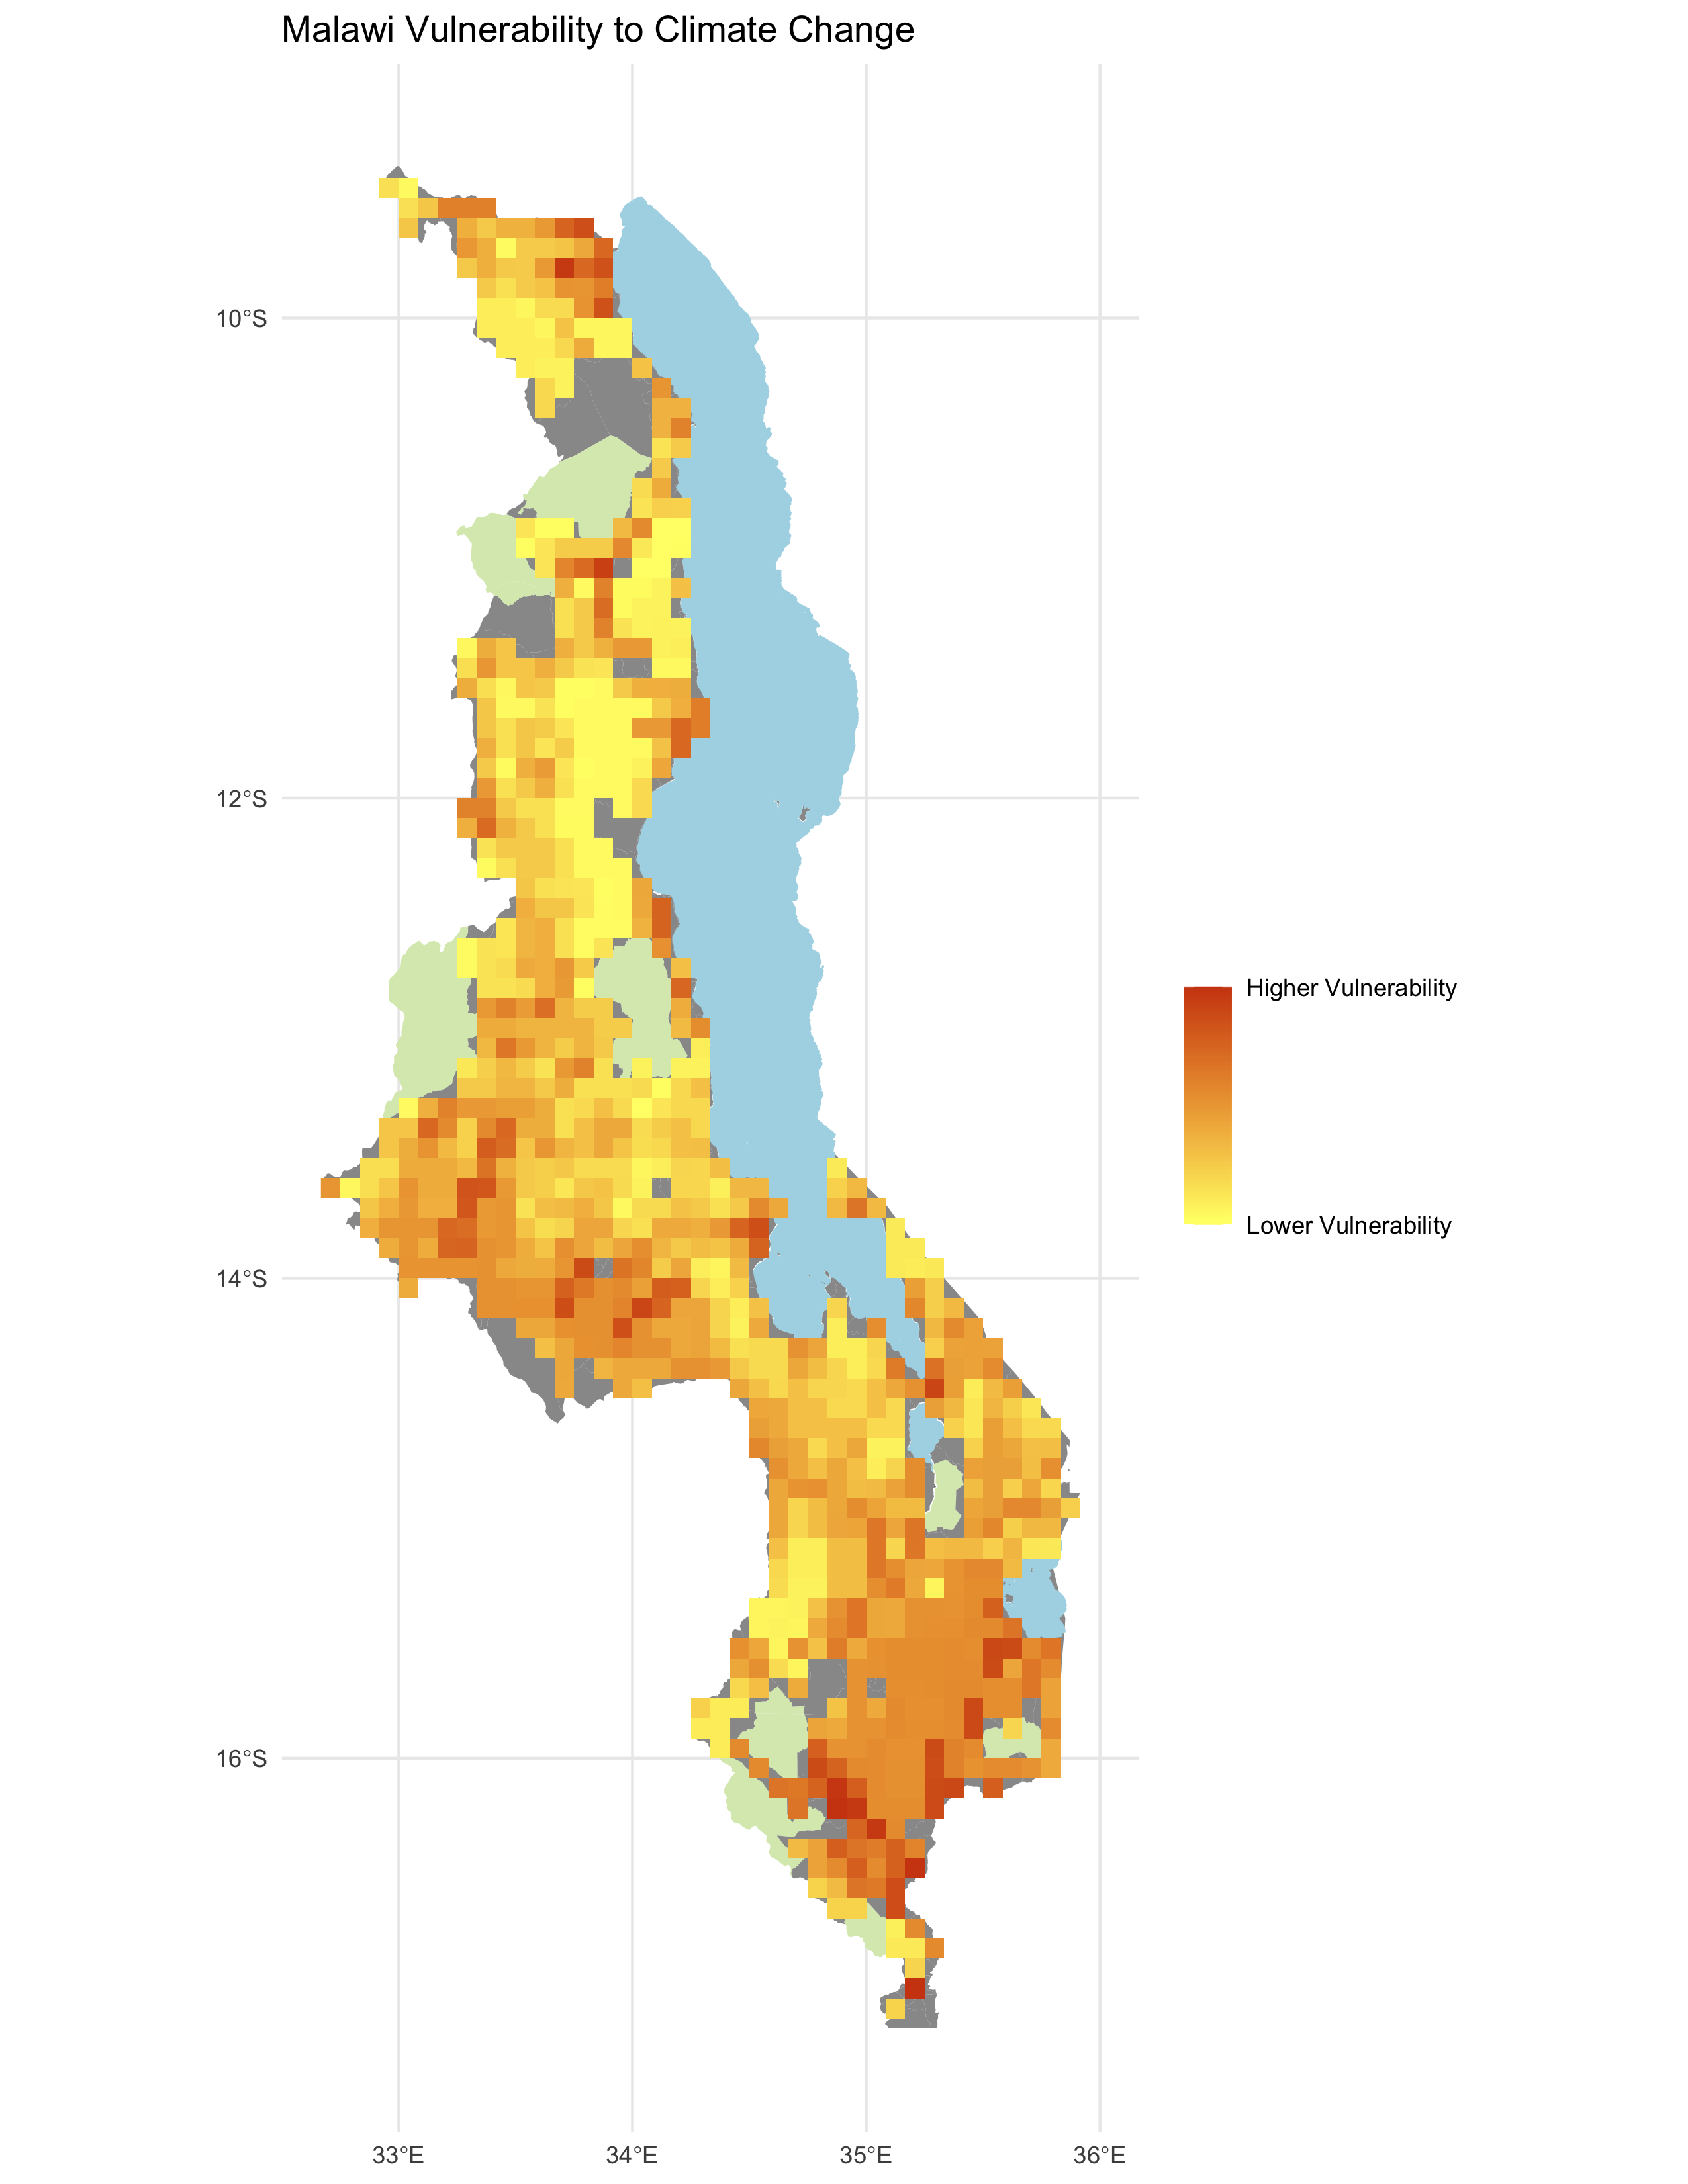 Reproduction of Malcomb et al. Figure 5.
Replications with new data can also illuminate how indicators may vary in importance over space and time. Factors such as gender roles, language, technology, and health outcomes carry different weight in different social contexts, and replication provides a framework for investigating that.
References
Malcomb, D. W., E. A. Weaver, and A. R. Krakowka. 2014. Vulnerability modeling for sub-Saharan Africa: An operationalized approach in Malawi. Applied Geography 48:17–30. DOI:10.1016/j.apgeog.2014.01.004.
Tate, E. 2013. Uncertainty Analysis for a Social Vulnerability Index. Annals of the Association of American Geographers 103 (3):526–543. DOI:10.1080/00045608.2012.700616.