Emma Waugh
Check out my work and reflections in Open Source GIScience!
Twitter Spatial Analysis of Hurricane Ida
Emma Waugh, Middlebury College
| Version 1.0 | Created 2021-11-29 | Last Updated 2021-12-19 |
The reproducible research compendium for this study is located here.
Introduction
Twitter data can be used to gain real-time information on natural disasters, such as wildfires and storms. Wang et al. (2016) used geocoded tweets with the words “wildfire” or “fire” in order to understand wildfire impacts over space and time. They show that the so-called “human-centric sensing technology” found in social media can provide useful information about both natural disasters and the discourse surrounding them, both of which are useful for understanding and preparing disaster response.
A replication of the Wang et al. study by Joseph Holler (2021) investigated Twitter activity during Hurricane Dorian, and whether the geographic distribution of Twitter activity was affected by former President Trump’s addition of Alabama to NOAA’s expected impact map (i.e. whether there was an increase of hurricane-related Twitter activity in Alabama as a result). In that study, the search terms “hurricane,” “Dorian,” and “sharpiegate” (a hashtag referring to Trump’s map incident) were used to query tweets. Twitter activity was normalized to baseline, non-hurricane season activity using the Normalized Difference Twitter Index. The replication also used local Getis-Ord G * to analyze spatial clusters.
This analysis aims to use Twitter data to investigate spatial patterns in Twitter discourse around Hurricane Ida, which occurred in late August to early September 2021. Over the course of a few days, the storm caused destruction of buildings, power outages, and flooding in the southeast and Mid-Atlantic, with severe and deadly flash flooding as well as power outages in New York and New Jersey. I also wanted to think critically about the use of this kind of analysis in disaster preparation and response.
Replication
See this blog post for some results of Holler’s study, and this GitHub repository for the full project repository.
Methods
In this replication, the search terms “hurricane” and “Ida” were used, as well as a 1000-mile radius around the coordinates 36, -87. Three separate queries were made: on September 2, 5, and 10, due to the extended impacts of the storm system. Additionally, since the storm made landfall in Louisiana on August 29, 2021 and then moved towards the northeastern U.S. by September 1-2, I divided part of the spatial analysis into August 29-31 and September 1-3, with code inspired by my classmate Liam Smith’s code.

Another classmate, Castin Stone, ran a query for baseline Twitter activity made at the same time and region, in order to normalize and understand hurricane-specific activity. Click here to view the script for this analysis.
Textual Analysis
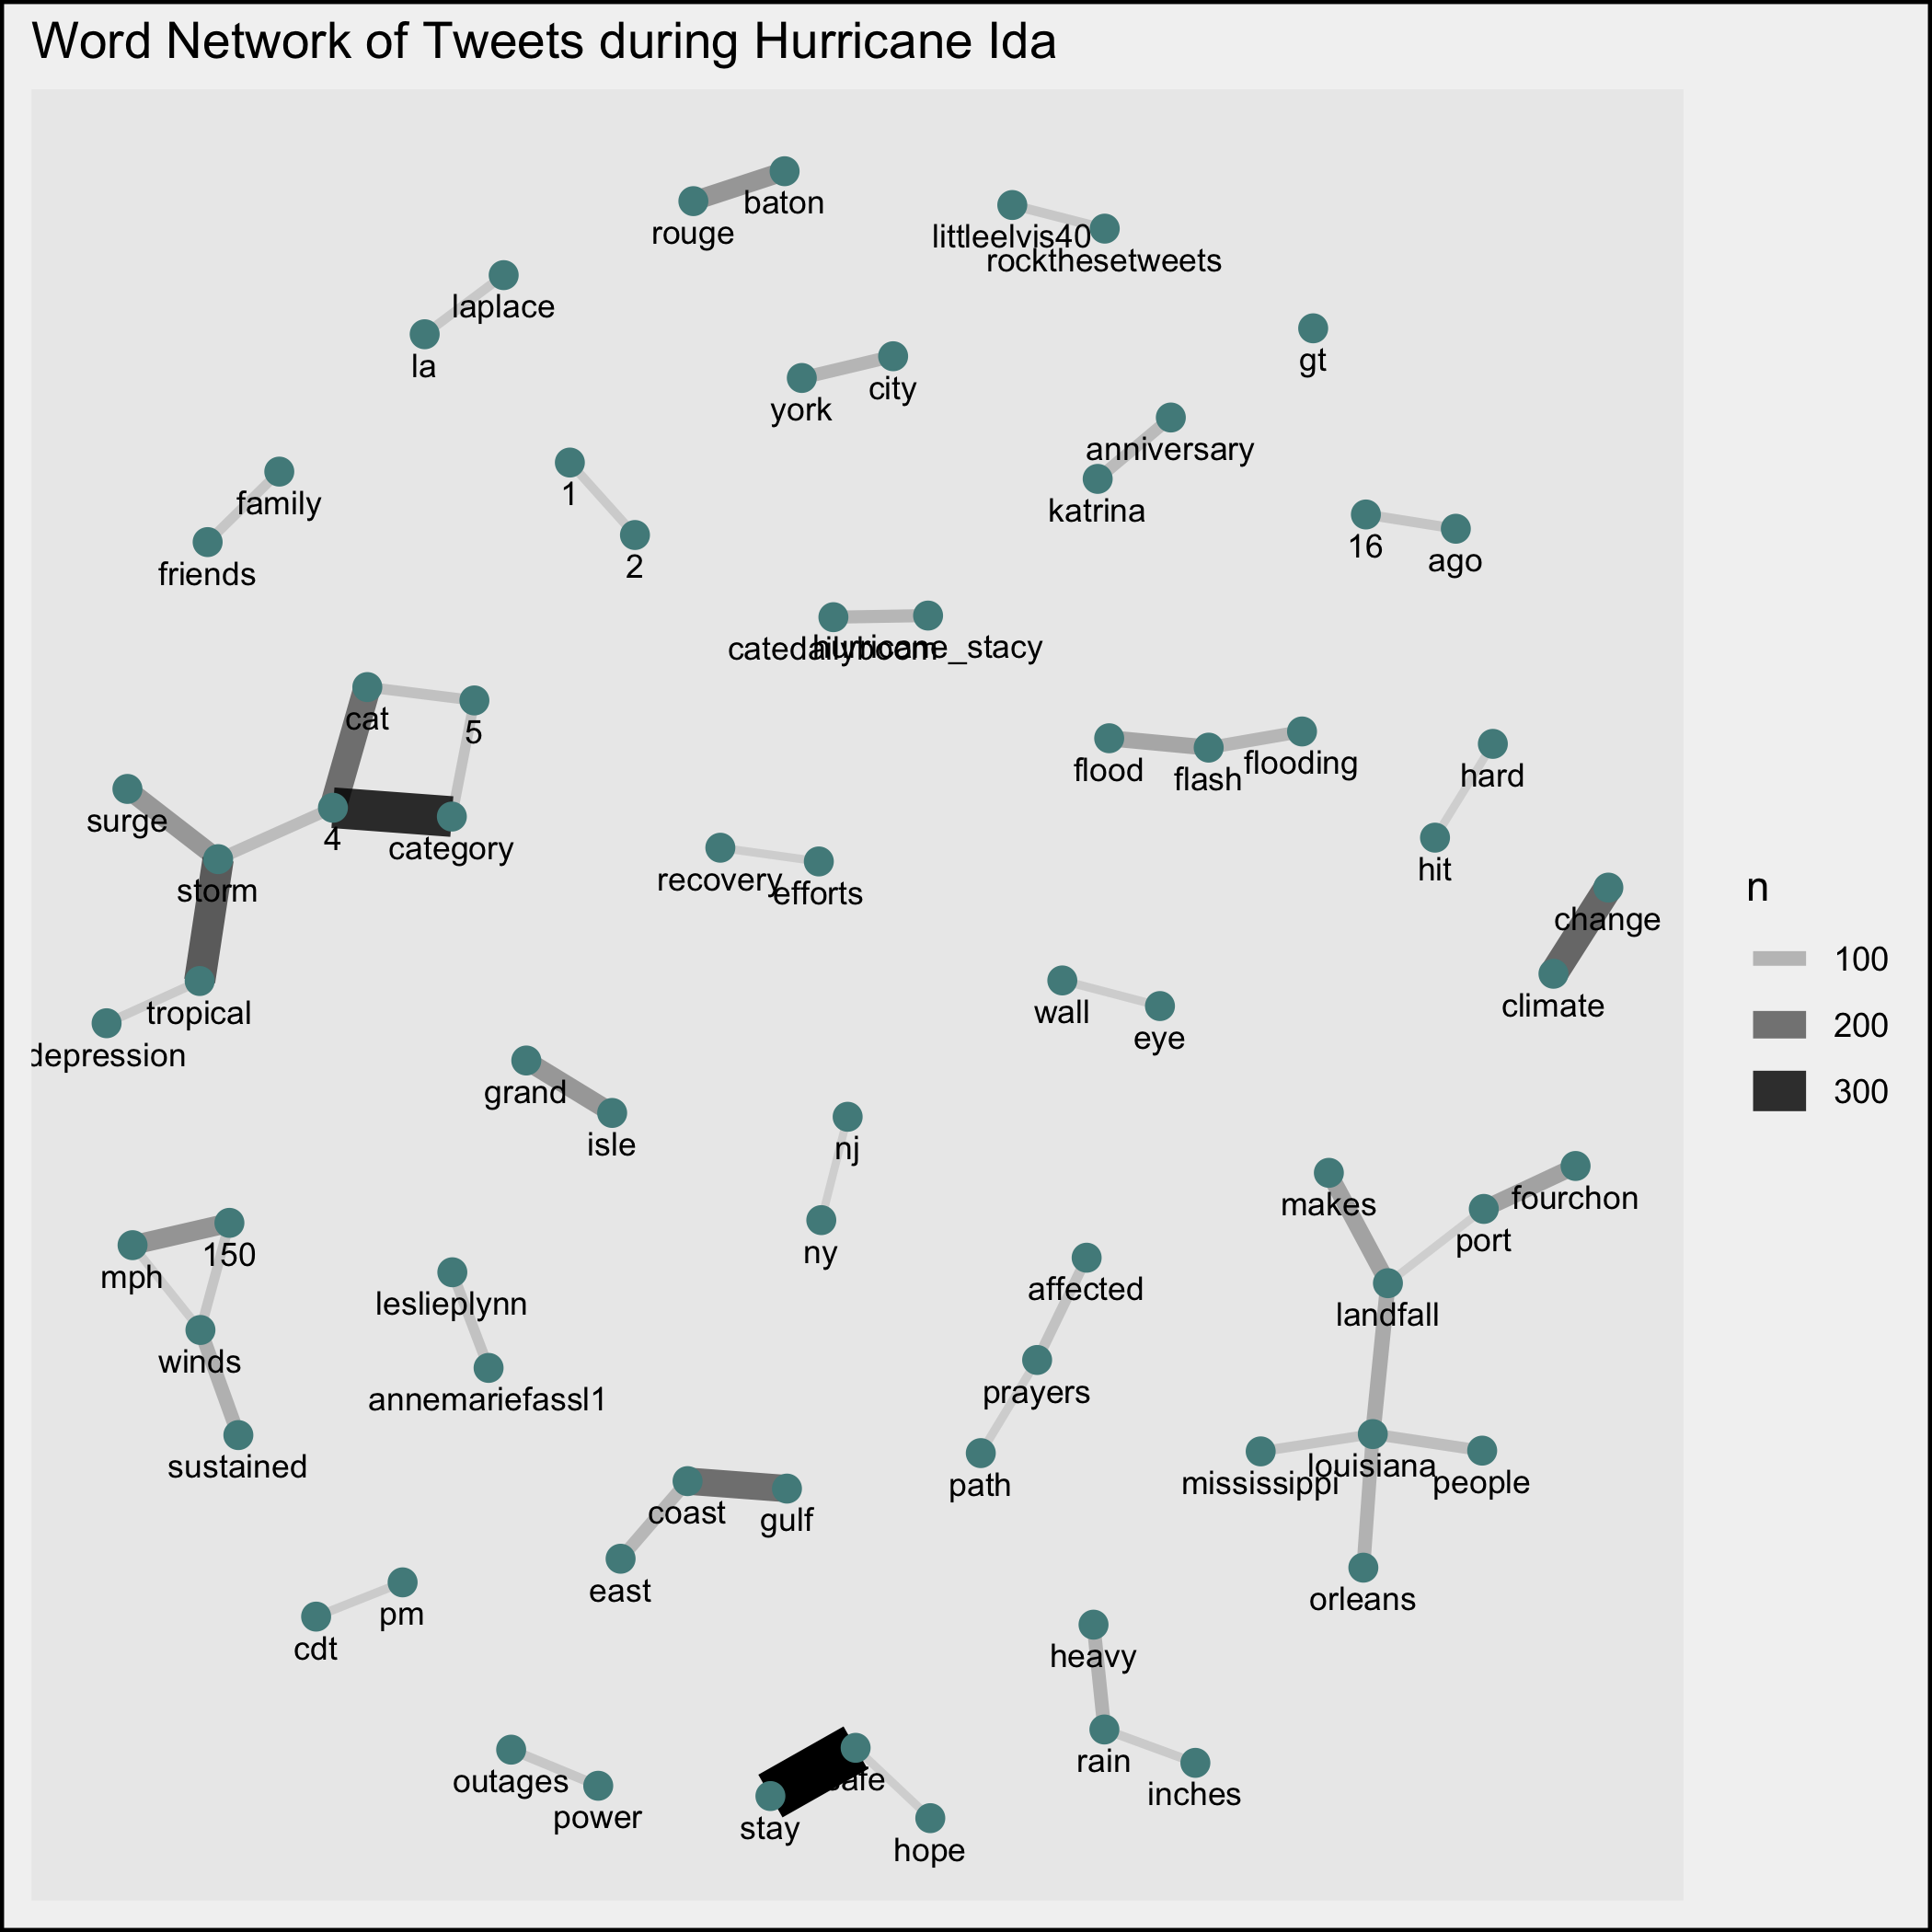
The text in the tweets was processed to remove plain language. The network analysis was accomplished using the rtweet network_graph function and igraph. Word freqency was plotted, alongside a word cloud for visualization (from the wordcloud package). A word association network graph was created using tidytext and ggraph.
Spatial Analysis
The spatial analysis was completed on the county level, using U.S. Census data, retrieved using a Census API. 31 states in the eastern U.S. were included in the analysis (see figures below).
Clusters
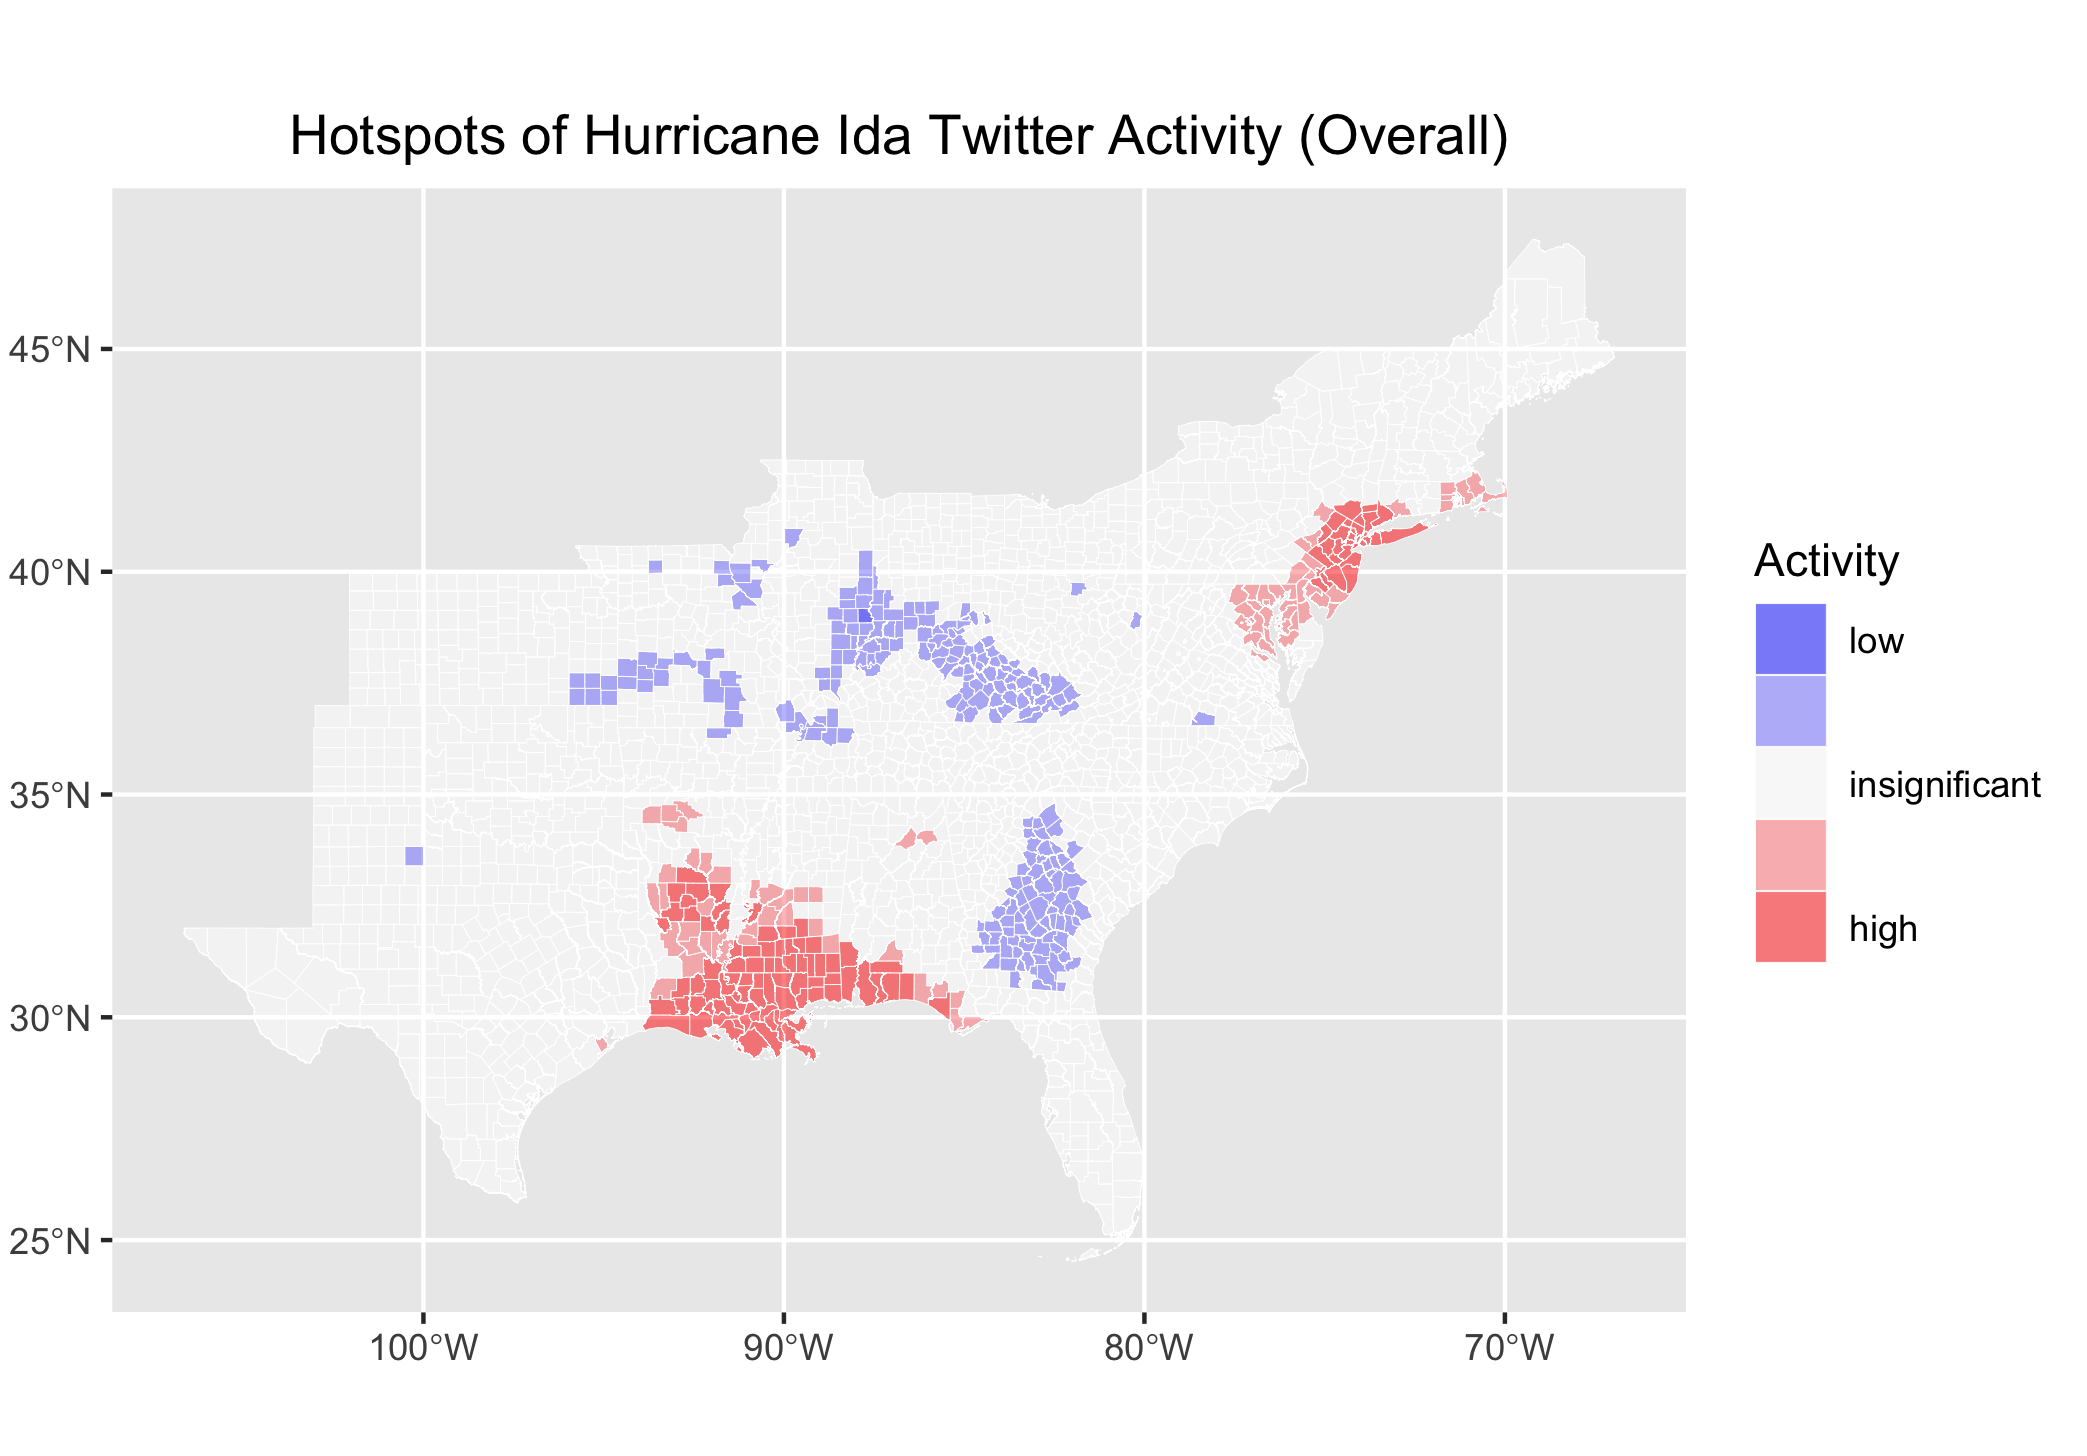
Tweets were joined to counties using the sf package, and tweet rates were normalized to population. The Getis-Ord G * statistic was calculated by first creating a spatial weight matrix (with spdep) to define neighborhoods within 110 km Euclidean distance, large enough for each feature to have at least one neighbor. Then a weight matrix was created from neighboring objects, and the Getis-Ord G * statistic was calculated. Hotspots were mapped with a 5-part classification based on Z-scores. The Getis-Ord G* statistic was used to analyze spatial clusters of activity, and to map them by county.
Normalized Difference Tweet Index
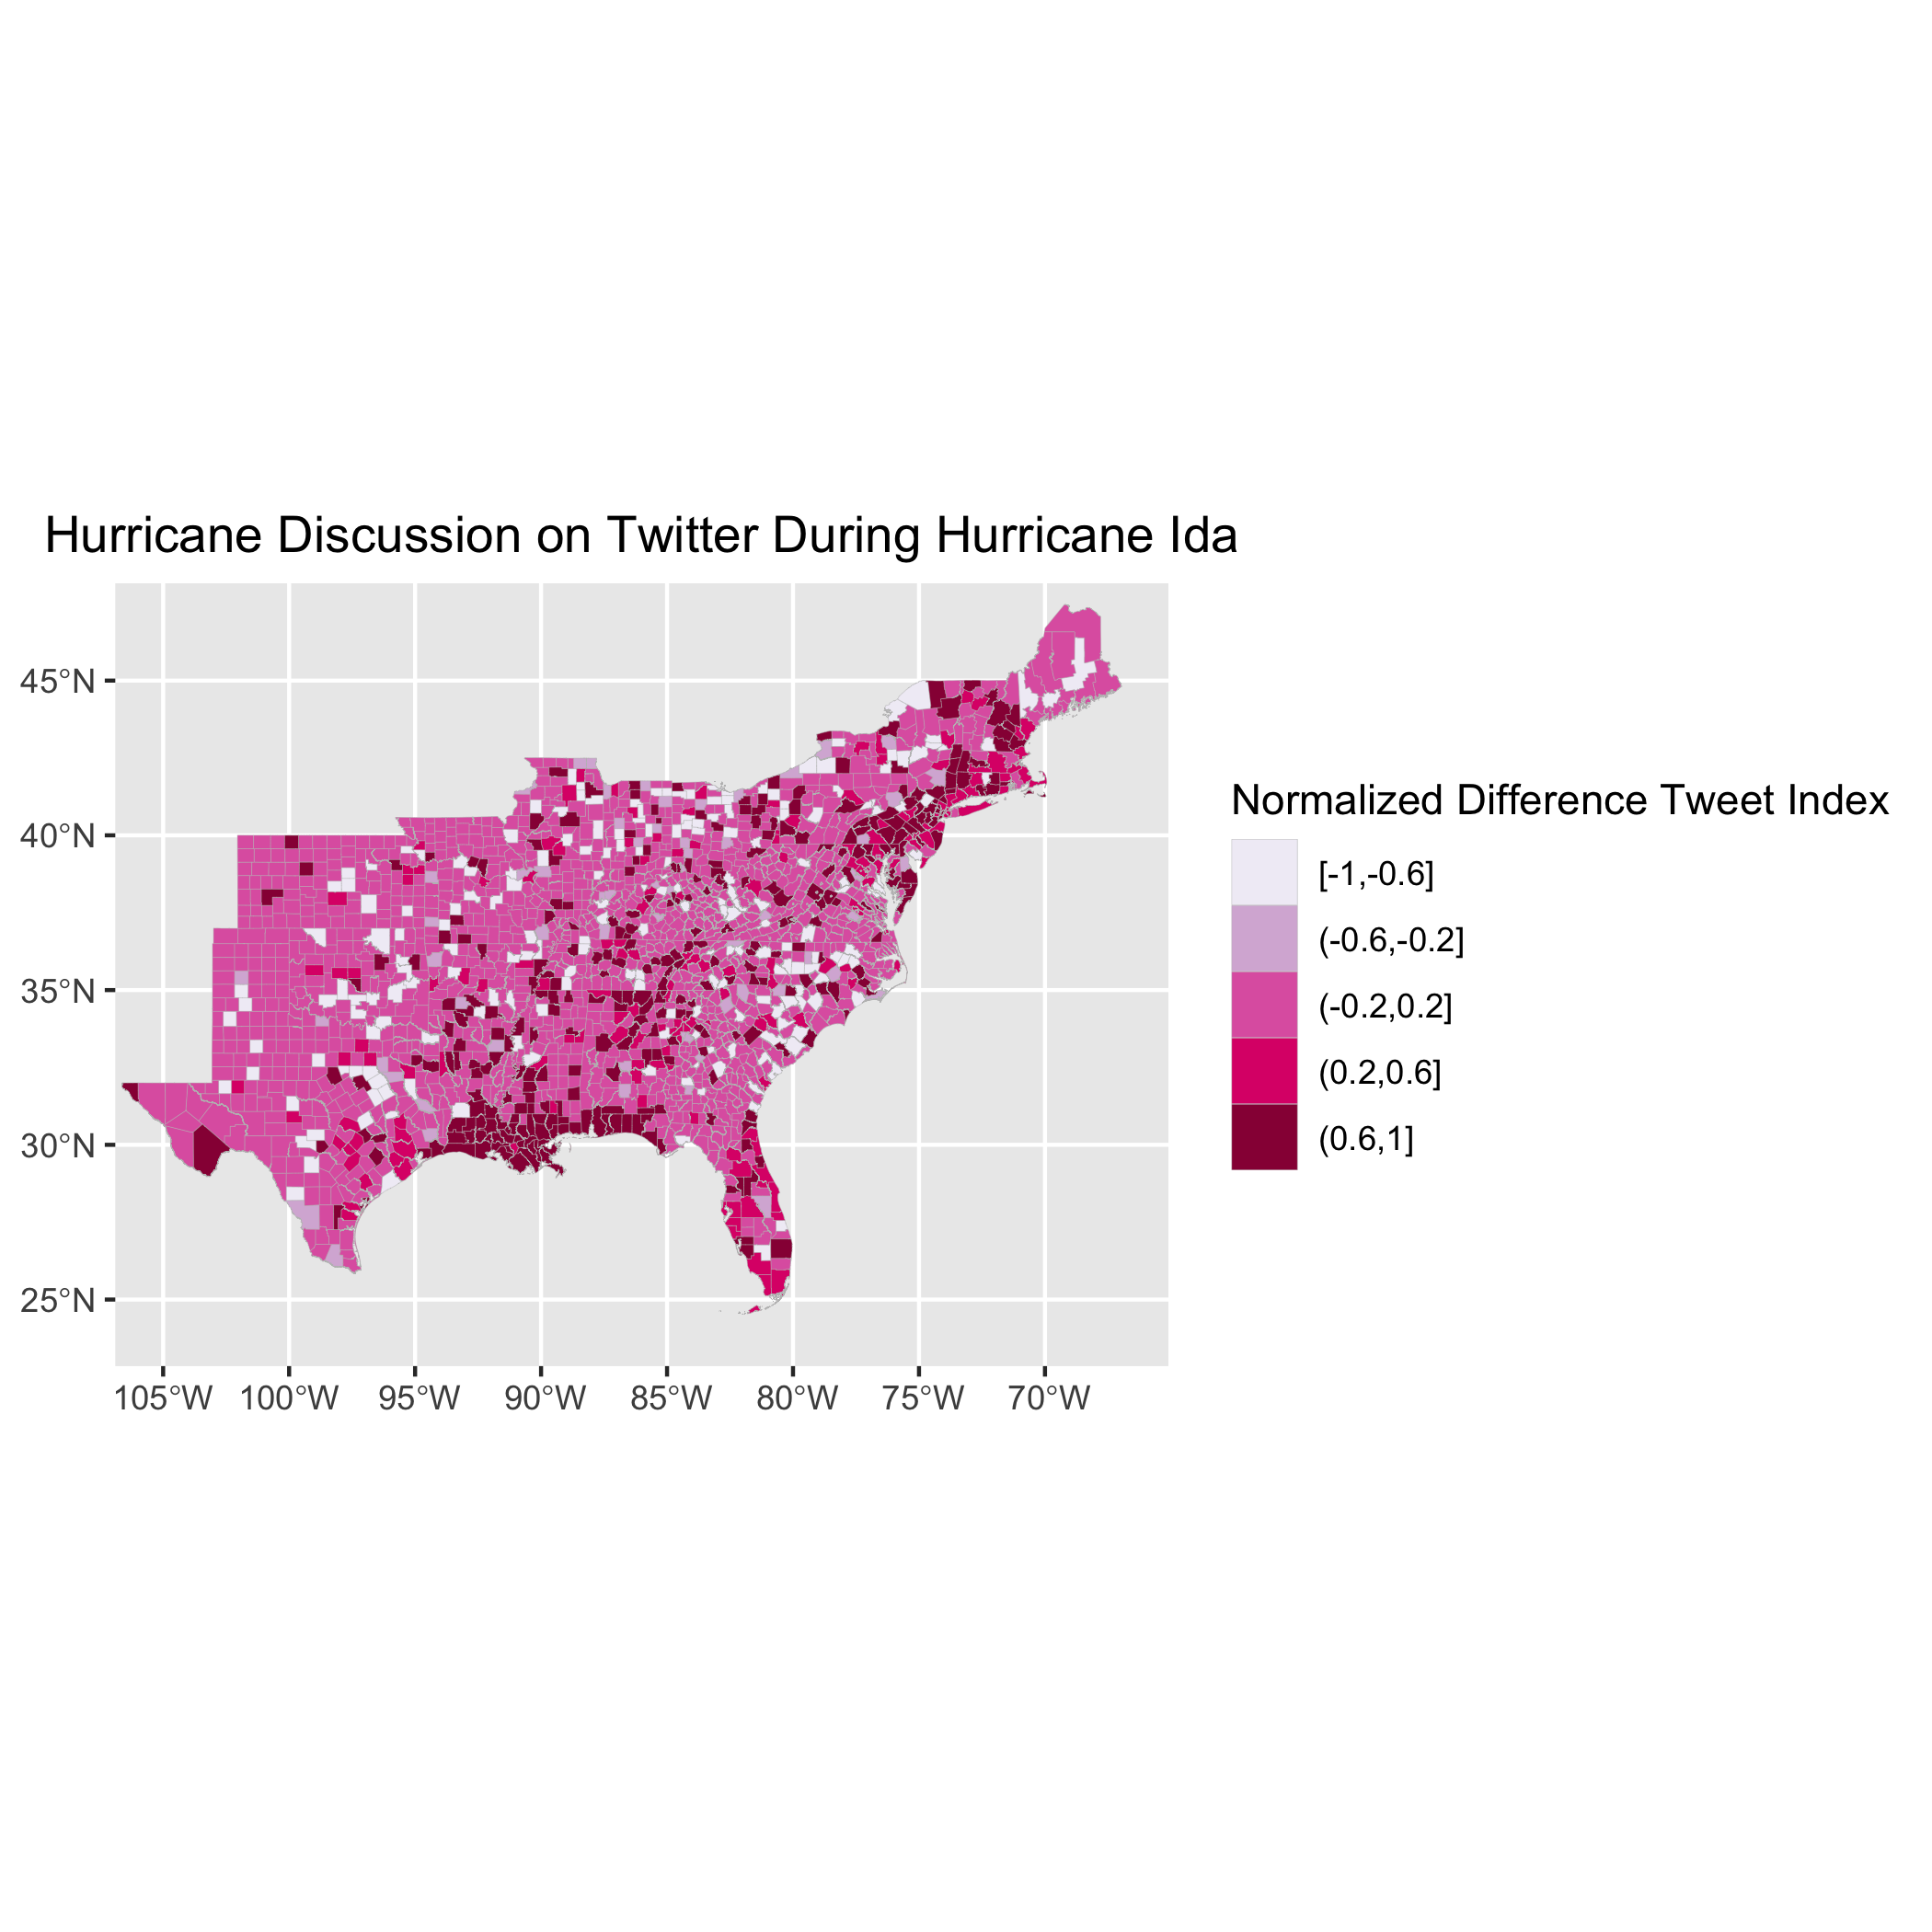
The spatial variation in Hurricane Ida-related Twitter activity can be represented with the a map of the Normalized Difference Tweet Index (NDTI), which is calculated using (event tweets - control tweets) / (event tweets + control tweets) where event tweets are those containing the search terms, and control tweets are from the baseline tweet dataset.
Changes to Original Code
In addition to editing the code from Holler’s Hurricane Dorian analysis, I added code for saving graphs and figures on all using ggsave. I also made edits to the extent of the graphs, added comments, and added a map of NDTI.
Results and Discussion
The word network shows mostly expected pairings: “climate change”, “stay safe”, and “category 4” are among the most frequently paired words. Some pairs of Twitter usernames (i.e. @littleelvis40 and @rockthesetweets) suggest prolonged discussions tagging those users. There are no political implications in this (see this blog post for a discussion of the word network during Hurricane Dorian), though there has been some discussion of the political decisions that resulted in the New York City Metropolitan Transit Authority’s inability to respond to floods in the subway system.
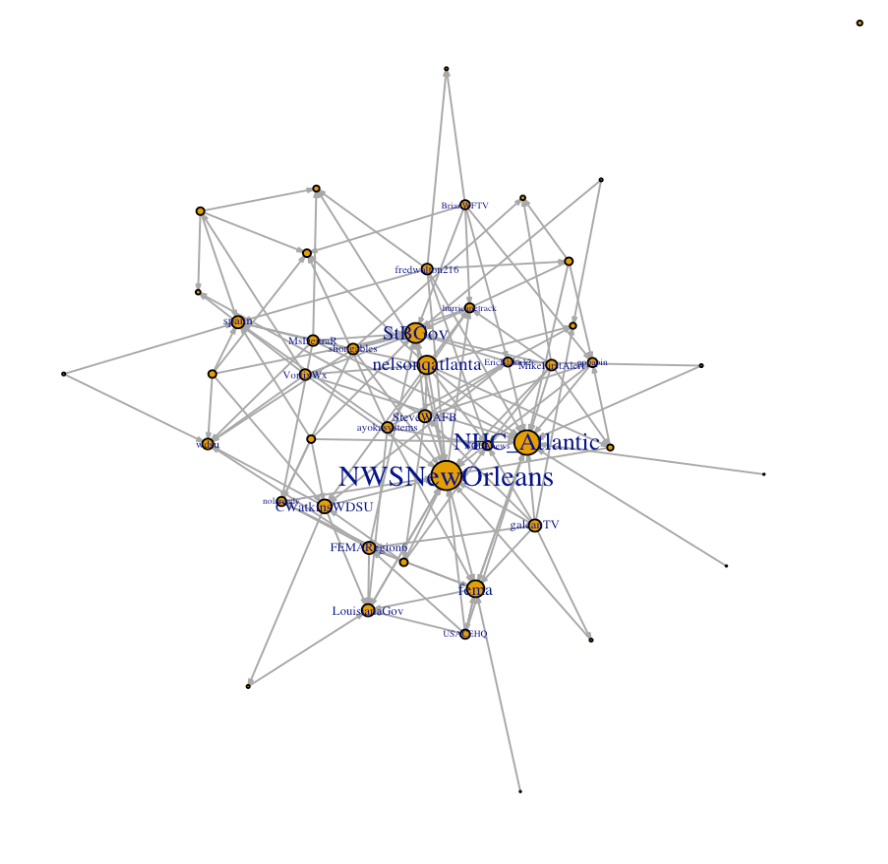
The retweet and quote tweet network highlights Twitter users that are retweeted and quote tweeted frequently. In this case, the National Weather Service in New Orleans (@NWSNewOrleans) and the National Hurricane Center (@NHC_Atlantic) are among the most-retweeted, along with journalists, other news station accounts, local governments, and government agencies. Wang et al. described a strong influence of news stations on information propagation during disasters, and the same can be seen in this case.
A map of the Normalized Difference Twitter Index shows that overall, activity was highest around the Louisiana coast (where Ida first made landfall and impacts were severe) and in areas of the northeast, where heavy rains led to dangerous floods).
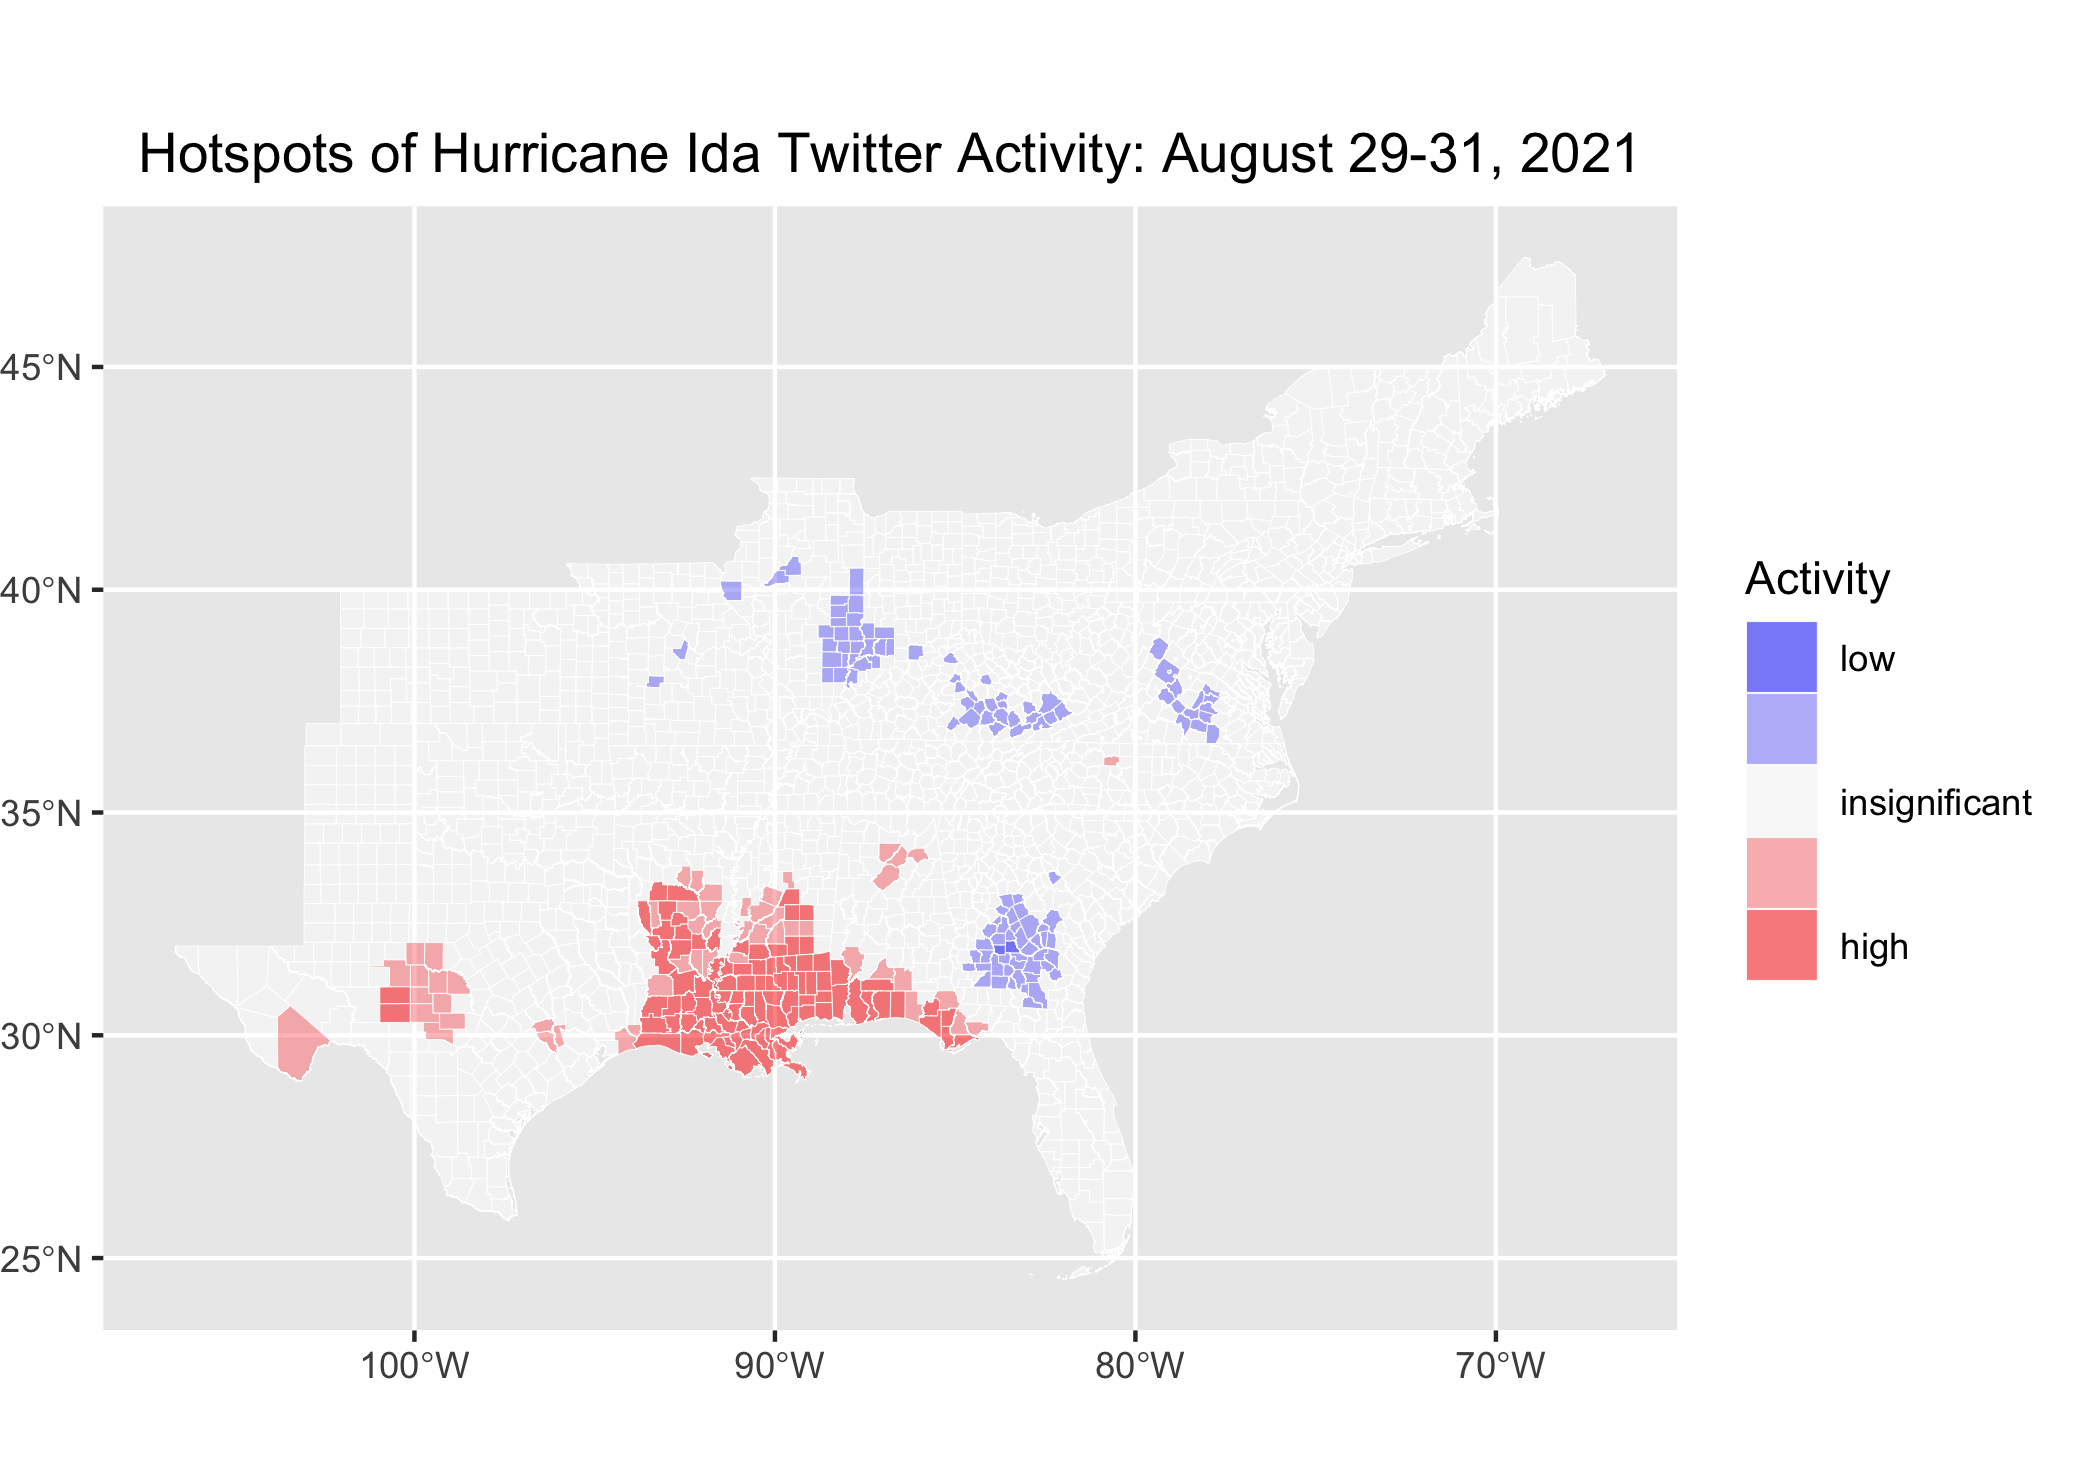
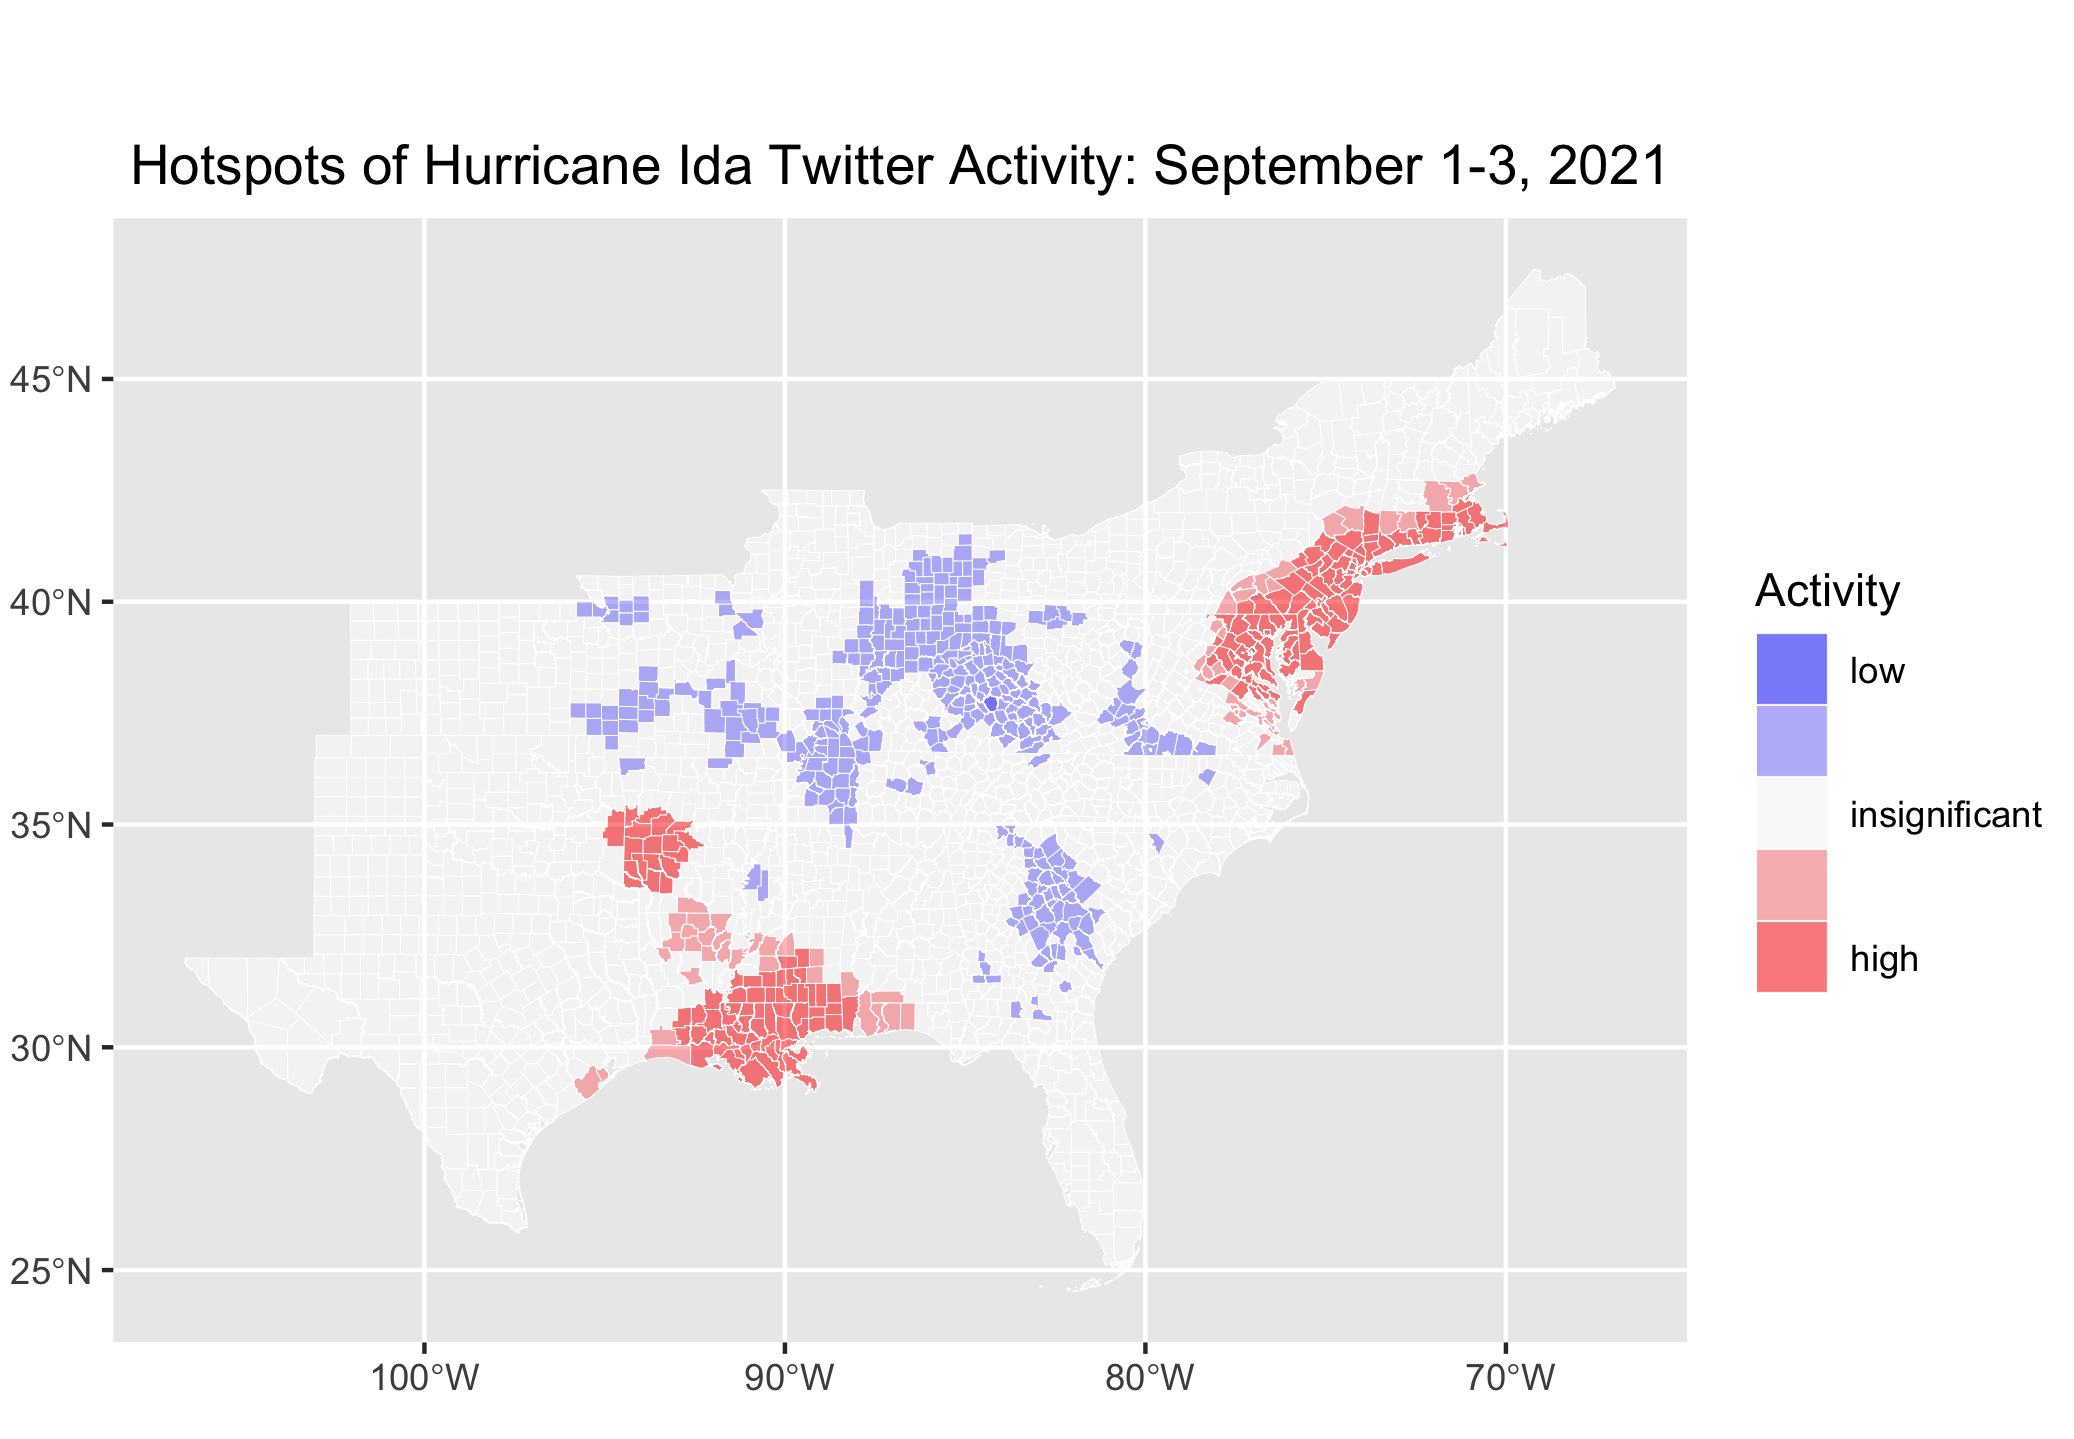
A map of activity clusters based on Getis-Ord G* scores similarly show that hurricane-related Twitter activity peaked in the northern Gulf Coast and the northern East Coast, where the storms impacts were most severe.
However, when Twitter activity is separated into August 29-31 (when Ida made landfall in Louisiana plus the following days) and September 1-3 (when heavy rains began in the northeast plus the following days), the clusters separate. It becomes apparent that the southeast was still feeling the impacts, which makes sense given that 90% of power customers in coastal Louisiana were still without power by September 3. The increase in “low” clusters later in the week could be explained by areas that escaped impacts and therefore ceased to tweet about the storm.
Conclusions
The replication of the Hurricane Dorian analysis (which was in turn a replication of Wang et al.’s wildfire study) provides an opportunity for comparison between these natural disasters and how social media is used to produce knowledge during them, as well as prepare and respond to disasters.
In this study, Twitter activity was correlated with the development of the storm both temporally and spatially. Wang et al. described a dominance by “elite” users such as local agencies and news outlets, which was observed here as well. However, as Crawford and Finn (2015) have discussed, Twitter activity is limited in its capacity to monitor long-term changes, as sensational events trend on social media days before being forgotten. Additionally, this study is limited by the relatively small number of geocoded tweets (less than 5% of tweets in this query were geocoded, which may not be representative of the true online response).
However, the trends in online responses could help in determining which areas need help the most, distributing information in aid efforts, and analyzing social and political opinions on the response, as well as for developing a better understanding of Twitter’s capacity as a tool in disasters.
References
Crawford, K., & Finn, M. (2015). The limits of crisis data: Analytical and ethical challenges of using social and mobile data to understand disasters. GeoJournal, 80(4), 491–502. DOI: 10.1007/s10708-014-9597-z.
Wang, Z., X. Ye, and M. H. Tsou. 2016. Spatial, temporal, and content analysis of Twitter for wildfire hazards. Natural Hazards 83 (1):523–540. DOI: 10.1007/s11069-016-2329-6.